Moving Averages in Trading: From Crossovers to Rainbows
⏱️ Estimated Reading Time: 6 minutes
📝 Summary: This guide explores advanced moving average strategies beyond simple crossovers. It details the “Rainbow” strategy using multiple MAs to visualize trend strength and introduces the Ichimoku Kijun-Sen as a superior dynamic stop-loss tool.
If you asked ten new traders to create a trading system, more than 70% would likely include moving average crossovers as a core component. Moving averages (MAs) are among the oldest technical indicators, having been used for nearly a century. But do basic crossovers actually work in modern markets?
Table of Contents
Key Takeaways
- Lag Factor: Standard crossovers often signal late, leading to losses in choppy markets.
- Rainbow Strategy: Using a band of MAs (6 to 24) helps visualize trend strength and noise.
- Dynamic Support: The Kijun-Sen (from Ichimoku) acts as a superior dynamic stop-loss level.
- Confluence: Combine MAs with other tools like RSI or Pivot Points for best results.
1. Do Crossovers Work? (The Golden Cross)
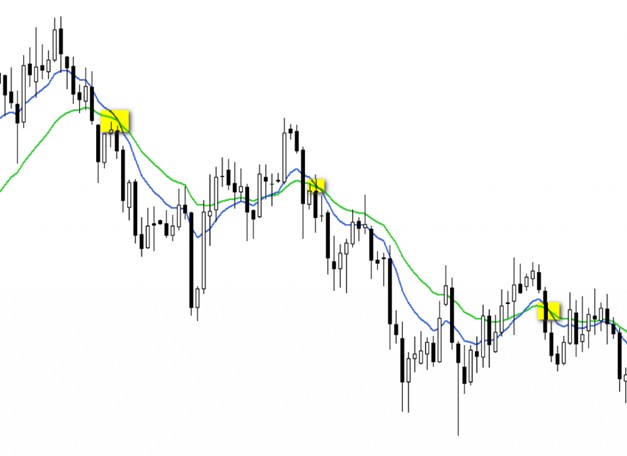
The Golden Cross (when a short-term MA crosses above a long-term MA) is a famous bullish signal. In strong trending markets, this works beautifully.
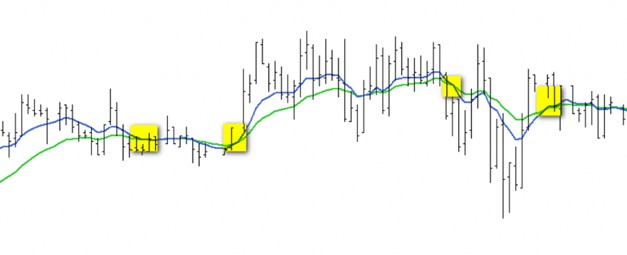
The Problem: In ranging or volatile markets, price fluctuates around the averages, triggering multiple false buy and sell signals. By the time the crossover confirms, the move may be over.
2. The Rainbow Strategy
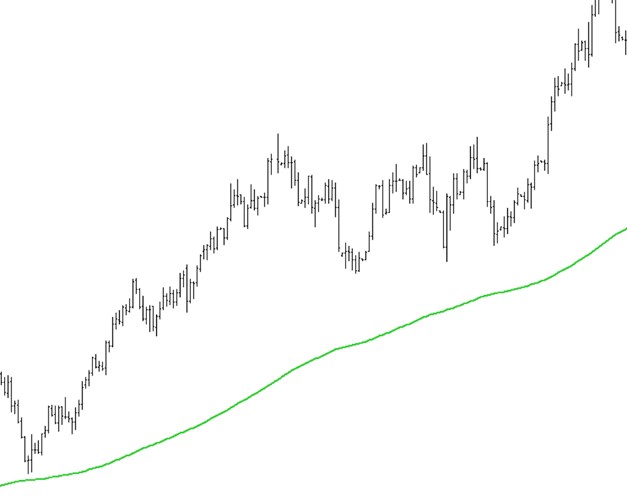
A more robust approach is the Rainbow Moving Average strategy. Instead of one or two lines, we apply a spectrum of Exponential Moving Averages (EMAs) ranging from 6 to 24 periods. We categorize them into colors:
- Violet/Blue (Long-term): Determines the overall trend direction.
- Red/Yellow (Short-term): Shows immediate price action.
How to Trade: Wait for the “Rainbow” to expand. When all lines fan out in the same direction, the trend is strong. If the lines are entangled, the market is noisy—stay out.
3. Kijun-Sen: A Better Moving Average
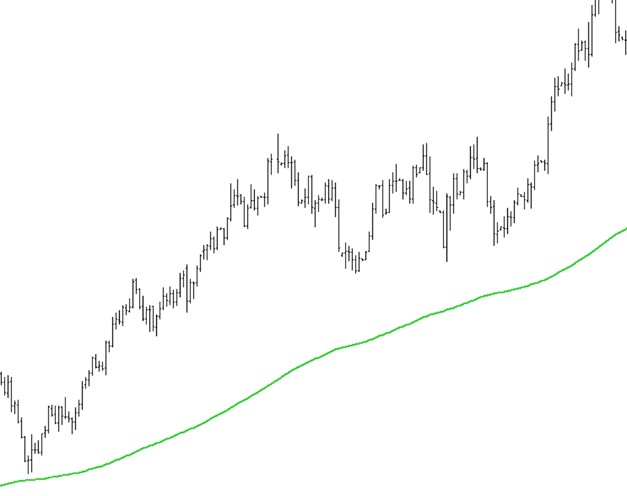
The Kijun-Sen (Base Line) from the Ichimoku system is calculated differently than a standard MA. It uses the average of the Highest High and Lowest Low over 26 periods.
Why it’s superior: It flattens out when the price ranges, clearly indicating neutral zones. It acts as a powerful dynamic support level. If price closes below the Kijun-Sen during an uptrend, it is an immediate exit signal.
4. Real Trade Examples
Let’s look at a GBP/JPY example. A strong downward movement began after breaking support. The Rainbow indicator fanned out, confirming strength. The Kijun-Sen trailed the price perfectly. A trader using the Kijun-Sen as a trailing stop would have captured the entire move, exiting only when the trend truly reversed.
Trend following made simple.
Use these advanced indicators on our platform and get cash back on every trade.
Frequently Asked Questions
SMA vs EMA: Which is better?
EMA (Exponential Moving Average) reacts faster to recent price changes, making it better for short-term trading. SMA (Simple Moving Average) is smoother and better for long-term support/resistance.
What is the best moving average setting?
There is no magic number. However, the 50-period and 200-period MAs are the most widely watched by institutions and often act as major support levels.
Does the Rainbow strategy work on all timeframes?
Yes, but it is most effective on trending timeframes like H1, H4, and Daily. On M1 or M5, the lines may get tangled frequently due to noise.
⚠️ Disclaimer: The content of this article is strictly for informational purposes and does not constitute investment advice. FXRebate is a cashback and affiliate service, not a broker or fund manager; responsibility for trades and funds lies exclusively with the third-party broker. Trading with leverage involves high risks of capital loss. Partner links used do not generate additional costs for you.