
RSI – Trading Guide for the Relative Strength Index
⏱️ Estimated Reading Time: 6 minutes
📝 Summary: The RSI (Relative Strength Index) measures the intensity of price movements. This guide explains how RSI is calculated, how to use it for identifying support/resistance breakouts, and how to trade divergences effectively.
The RSI (Relative Strength Index) is among the most widely used indicators by traders. As its name suggests, RSI provides information about the intensity of price movements on a chart. This article will teach you how RSI works, how to interpret its results, and how to use it in trading.
Table of Contents
1. How RSI Calculation Works
The standard setting for the RSI indicator is 14 periods, meaning it analyzes the last 14 candlesticks. RSI compares the average gain to the average loss, evaluating how many of the last 14 candlesticks were bullish or bearish, as well as the size of each candlestick.
For example, if all 14 candlesticks were bullish, the RSI value would be close to 100. An RSI of 50 indicates an equal balance between bullish and bearish momentum.
Example 1: Strong Bullish Momentum
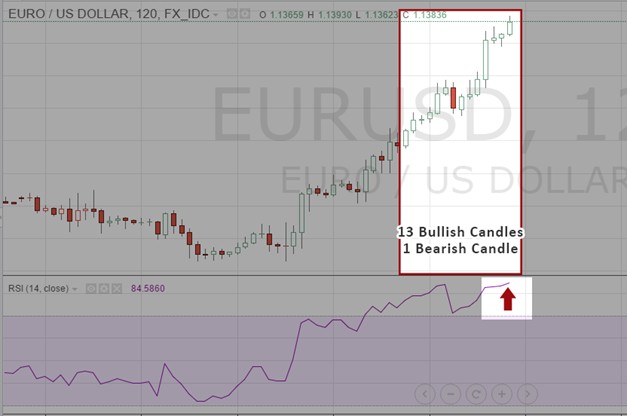
The screenshot below captures the EURUSD chart. The area highlighted includes 14 candlesticks. Of these, 13 were bullish and only one was bearish, resulting in a very high RSI of 85.
2. Analyzing Market Zones with RSI
To better understand the calculation, let’s look at another example with three distinct zones of 14 candlesticks each.
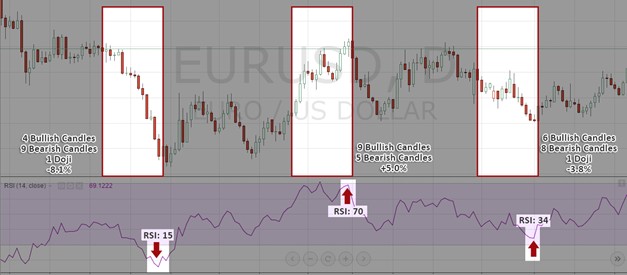
- Zone 1: A bearish period with 9 bearish candlesticks. The RSI value was 15, signaling a strong downward phase.
- Zone 2: A mixed period. Although there were bullish candles, they were small (Doji-like). The RSI reflected this indecision.
- Zone 3: A clear bullish move, pushing the RSI back up to 70.
3. Support & Resistance on RSI
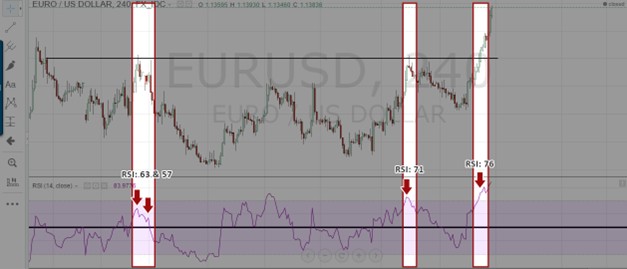
RSI is not just a line at the bottom of your chart; it can be analyzed using technical tools just like price action. You can draw support and resistance lines directly on the indicator window.
Often, the RSI will break a trendline before the price does, acting as a leading indicator for breakouts.
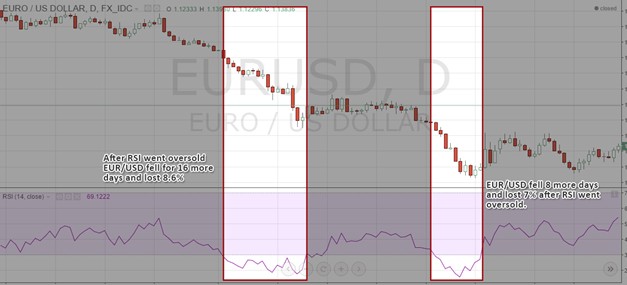
Furthermore, identifying horizontal support and resistance levels on the RSI helps in spotting overbought (above 70) and oversold (below 30) conditions more accurately than using the default fixed levels.
4. RSI Divergence
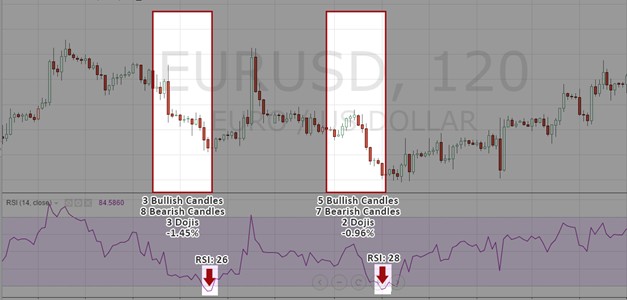
Another powerful way to use RSI is by spotting divergences. A divergence occurs when there is a mismatch between price action and the oscillator’s dynamics.
In the example below, the price makes a lower low, but the RSI makes a higher low (28 compared to 26 previously). Although the price dropped, the selling intensity was weaker than before. This “Bullish Divergence” often signals that the bears are losing strength and a reversal is imminent.
Conclusion
RSI is a versatile and highly useful tool. Whether you use it to identify trend intensity, spot reversal points via divergence, or trade breakouts on the indicator itself, it adds objective stability to your trading approach. By numerically determining price intensity, you can avoid subjective assumptions.
Test the RSI Strategy.
Practice spotting divergences and trendline breaks on a demo account with a regulated broker.
Frequently Asked Questions
What is the best period for RSI?
The standard and most widely used setting is 14 periods. Lower settings (e.g., 9) make it more sensitive, while higher settings (e.g., 21) make it smoother but slower.
Can RSI stay overbought for a long time?
Yes. In strong trends, RSI can remain above 70 (or below 30) for extended periods. This indicates a strong trend, not necessarily an immediate reversal.
What is a failure swing?
A failure swing occurs when the RSI enters overbought territory, drops, rallies again but fails to reach the previous high, and then breaks the recent low. It is a strong reversal signal.
⚠️ Disclaimer: The content of this article is strictly for informational purposes and does not constitute investment advice. FXRebate is a cashback and affiliate service, not a broker or fund manager; responsibility for trades and funds lies exclusively with the third-party broker. Trading with leverage involves high risks of capital loss. Partner links used do not generate additional costs for you.