
Trend Trading with Bollinger Bands & EMA 50
This strategy combines the volatility-measuring power of Bollinger Bands with the trend-defining capability of the 50-period Exponential Moving Average (EMA). It is a classic “pullback” strategy designed to enter established trends on the H4 timeframe when price retraces to the mean.
Strategy Profile
Timeframe
H1, H4
Pairs
Majors (EUR, GBP, JPY)
Indicators
BB (Dev 3) + EMA 50
1. Indicator Setup
Configure your chart with the following settings:
- Bollinger Bands: Period 20, Shift 0, Deviation 3. (Note: Deviation 3 is wider than the standard 2, filtering for stronger volatility). (Green Lines)
- Exponential Moving Average (EMA): Period 50, Shift 0. (Orange Line)
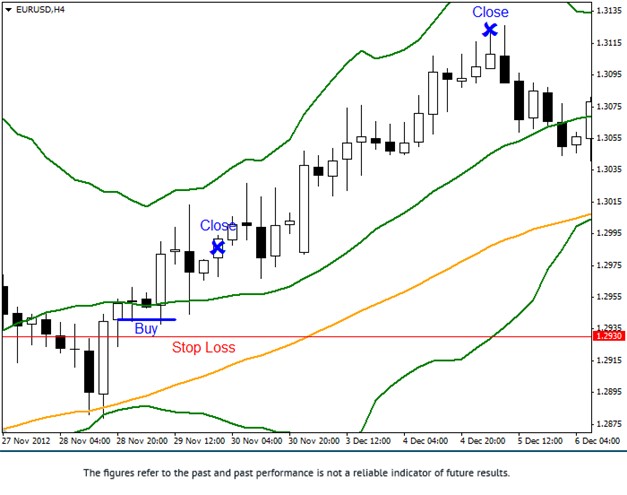
2. Long Entry (Buy) Rules
Look for a pullback in an uptrend:
- Trend: Price must be floating ABOVE the Orange EMA 50 line.
- Pullback: The price touches (or nearly touches) the Middle Green Line of the Bollinger Bands.
- Trigger: Open a Buy trade once a candle breaks the High of the previous candle.
3. Short Entry (Sell) Rules
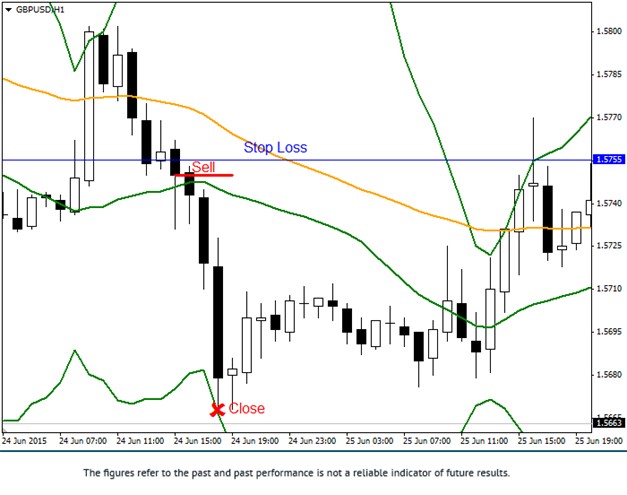
Look for a pullback in a downtrend:
- Trend: Price must be floating BELOW the Orange EMA 50 line.
- Pullback: The price touches (or nearly touches) the Middle Green Line of the Bollinger Bands.
- Trigger: Open a Sell trade once a candle breaks the Low of the previous candle.
Trade Management
- Stop Loss: Place at the level of the Orange EMA 50 line.
- Take Profit: Target the Upper Band (for Buy) or Lower Band (for Sell).
- Optional: Use a Trailing Stop of 20 pips to lock in profits.
Trade with the Trend: Enhance your strategy’s profitability with FXRebate cashback.