
The Anti-trend Strategy: Trading Indices Reversals
The “Anti-trend” strategy is a contrarian system designed to identify market reversals at their extremes. By combining volatility bands with momentum oscillators, this approach allows traders to fade the current move, capitalizing on the principle of mean reversion when prices overextend.
Strategy Profile
Indicators
RSI & Bollinger Bands
Type
Reversal / Contrarian
Risk
High Reward
1. Indicator Setup
This strategy relies on the interaction between price volatility and momentum. Configure your chart with:
- Bollinger Bands: Period 20, Deviation 2 (Standard).
- RSI (Relative Strength Index): Period 14, with levels at 30 (Oversold) and 70 (Overbought).
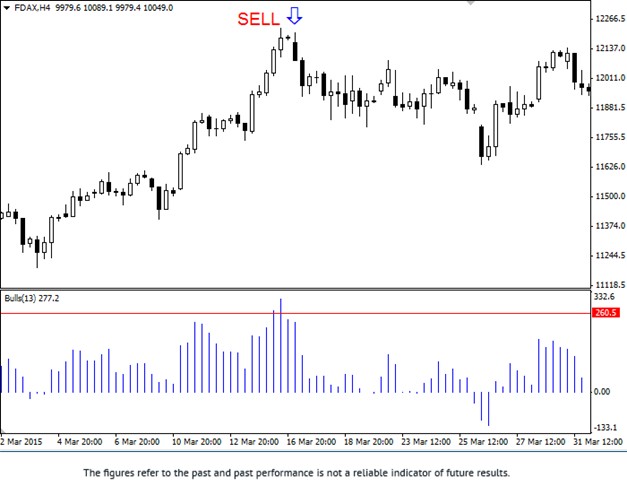
2. Short Entry (Sell) Rules
Look for opportunities to sell when the market is overextended to the upside:
- Price Action: The price candle must touch or break through the Upper Bollinger Band.
- Momentum: The RSI indicator must be above 70 (Overbought zone).
- Trigger: Enter Sell when the candle closes, expecting a reversal towards the middle band.
3. Long Entry (Buy) Rules
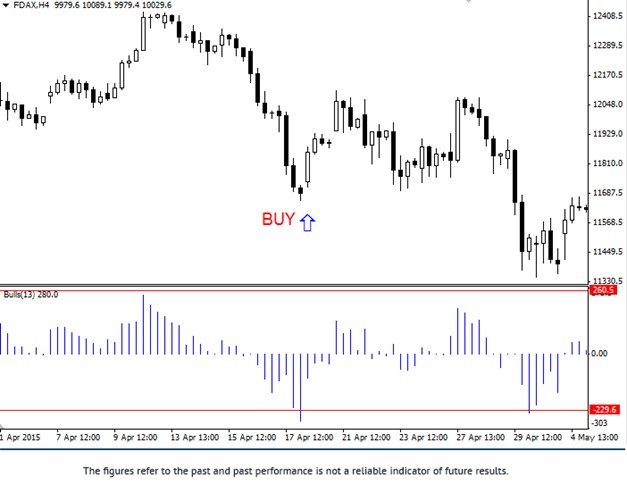
Look for opportunities to buy when the market is overextended to the downside:
- Price Action: The price candle must touch or break through the Lower Bollinger Band.
- Momentum: The RSI indicator must be below 30 (Oversold zone).
- Trigger: Enter Buy when the candle closes, expecting a reversal towards the middle band.
Trade the Reversal: Apply the Anti-trend strategy on Indices and Forex to catch market turns and earn cashback.