
When to Take Profit: Stop Guessing, Start Targeting
⏱️ Estimated Reading Time: 7 minutes
📝 Summary: Taking profit is often harder than entering a trade. This guide explains why moving averages often lag for exits and demonstrates how to use Pivot Points and Fibonacci Extensions for precise targets.
Taking profit is a crucial step—it’s the moment when your paper gains become realized capital. While entering a trade gets all the attention, closing a trade is what determines your actual success. In this article, I will share several insights on how to exit trades effectively using key market levels rather than guessing.
Table of Contents
1. Signals from Moving Averages Are Not Always Ideal
I still see traders basing their exit decisions on signals generated by moving averages or oscillators (like MACD). While useful for entries, these indicators have a significant lag and are not recommended when you aim to close a position at the optimal peak.
Strong price movements often occur around key levels known to institutional traders. If you wait for a closing signal from an oscillator, professionals have most likely already exited their positions.
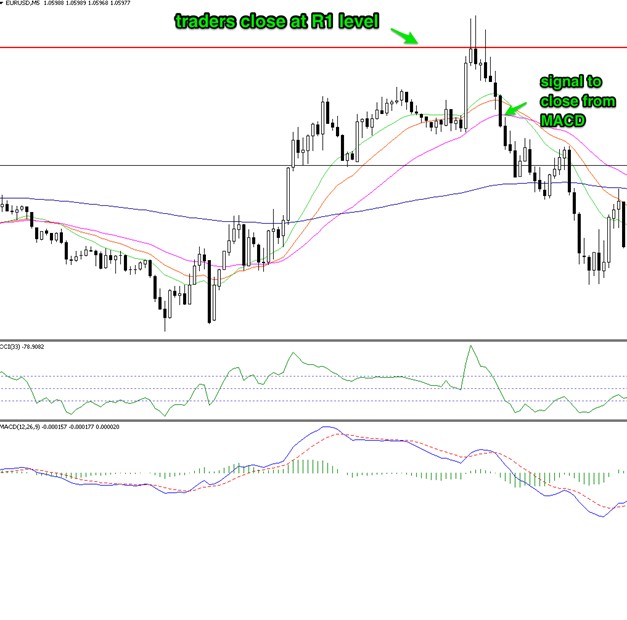
For example, in the 5-minute EUR/USD chart below, a strong upward move ends exactly at the R1 Pivot line. The price tried to break higher but encountered strong resistance. If you had attempted to close based on an indicator crossover, you would have given back a large portion of the profit.
2. Pivot Points Are Very Important
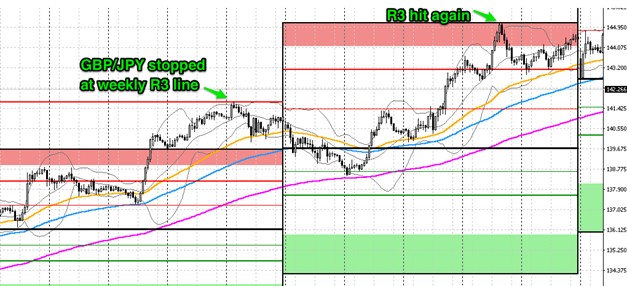
Pivot points are calculated based on the previous day’s high, low, and close. They provide objective support and resistance levels (S1, S2, R1, R2) that do not change during the day.
Unlike dynamic indicators that repaint, Pivot Points give you a fixed roadmap for the day. Traders use these levels to place “Take Profit” orders, knowing that price often pauses or reverses at these mathematical boundaries.
3. Real Example: DAX & S2 Level
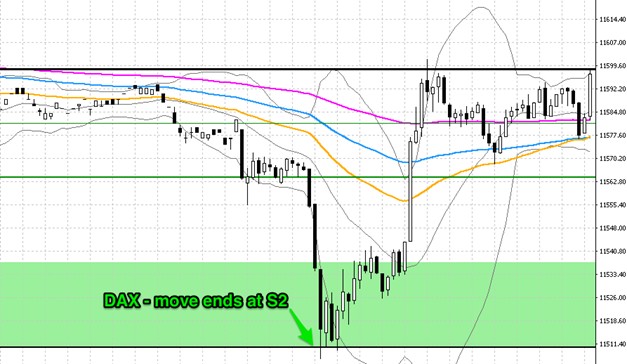
Let’s look at a practical example on the DAX index. A sharp decline occurred, seemingly without end. However, the drop stopped precisely at the S2 (Support 2) Pivot line.
If you had pivot lines on your chart, you would have known to consider closing your short position around that level. Without them, you might have held the trade too long, expecting the crash to continue, only to see the price bounce back.
4. Fibonacci Works Well Too
Fibonacci extension lines are another effective tool for setting take profit levels, especially when the price is in “discovery mode” (breaking new highs or lows).
- The Drawback: You need to know how to draw them correctly (identifying Point A and Point B).
- The Advantage: They project potential future targets beyond current price action.
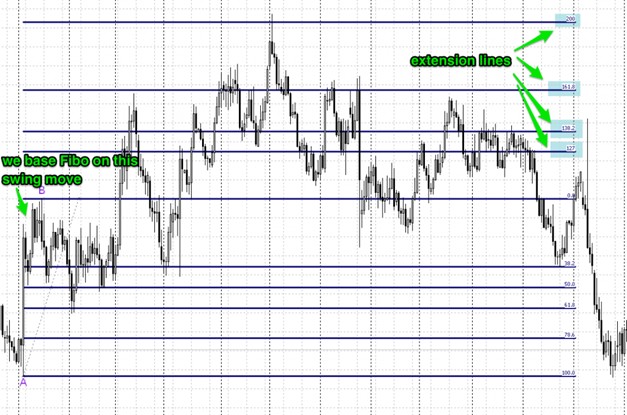
The movement from Point A to Point B defines the base. The area beyond Point B offers potential exit levels, with 161.8% being the most frequently used target by professionals.
Confluence Zones
For the highest probability exits, look for confluence. This happens when a Fibonacci extension (like 161.8%) lines up perfectly with a Pivot Point (like R2) or a major Support/Resistance level.
Practice Targeting Profits.
Test Pivot Points and Fibonacci on a free demo account with a regulated broker.
Frequently Asked Questions
Which Pivot Point calculation is best?
The Standard (Classic) Pivot Point formula is the most widely used by institutional traders and algorithms, making it the most reliable for identifying reaction levels.
Can I use Fibonacci for Stop Loss?
Yes. Just as extensions work for targets, retracement levels (like 61.8% or 78.6%) can serve as invalidation points to place your Stop Loss behind.
Is 1:2 Risk-Reward always necessary?
It is recommended. If your target (based on Pivots/Fibonacci) doesn’t offer at least double your risk, it might be better to skip the trade.
⚠️ Disclaimer: The content of this article is strictly for informational purposes and does not constitute investment advice. FXRebate is a cashback and affiliate service, not a broker or fund manager; responsibility for trades and funds lies exclusively with the third-party broker. Trading with leverage involves high risks of capital loss. Partner links used do not generate additional costs for you.