Support and Resistance: Essential Indicators for Market Interpretation
⏱️ Estimated Reading Time: 8 minutes
📝 Summary: Support and Resistance are the pillars of technical analysis. This guide covers how to identify these zones (not lines), understanding role reversals, and avoiding common beginner mistakes like over-marking charts.
When analyzing a chart, the primary objective is to identify levels where price tends to reverse or react. Recognizing these zones grants a strategic advantage in investment planning, as price behavior often follows cyclical patterns. If the market previously rejected a specific level, it is highly probable that it will respond similarly when revisiting that level in the future.
Table of Contents
1. What Is the Difference Between Support and Resistance?
While analyzing charts, traders aim to detect significant price levels both above and below the current market price:
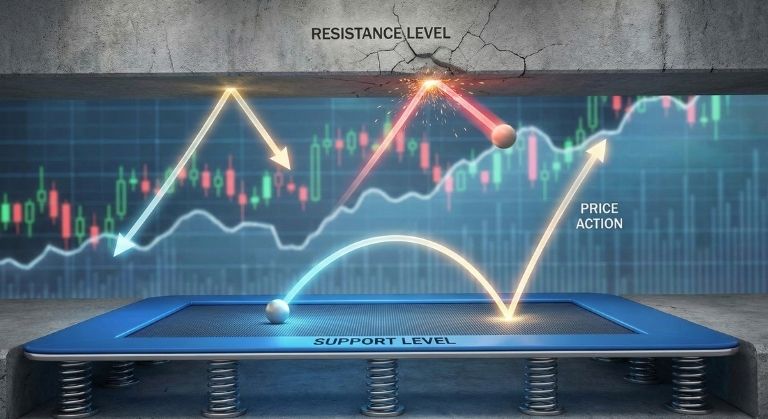
- Resistance: Upper levels where upward movements are likely to face selling pressure.
- Support: Lower levels where downward moves may encounter buying interest.
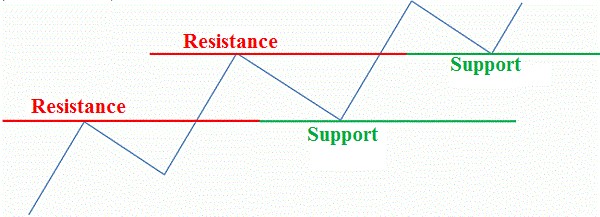
The general principle is that a rising price tends to meet resistance, and a falling price finds support. Interestingly, if a resistance level is broken during an uptrend, it often flips roles and becomes support—and vice versa.
2. Zones, Not Exact Lines
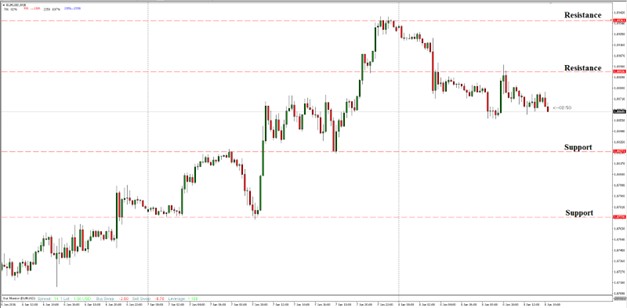
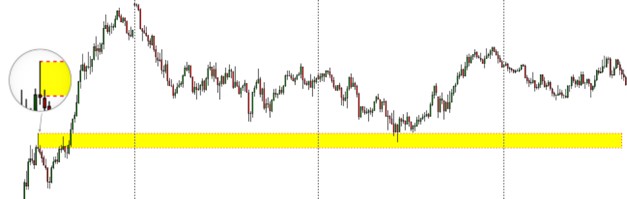
It is important to emphasize that support and resistance are not precise price points (e.g., 1.1050), but rather zones or areas. Hence, attempting to define them with a single exact price is misleading and can lead to missed trades.
3. How Are Levels Determined?
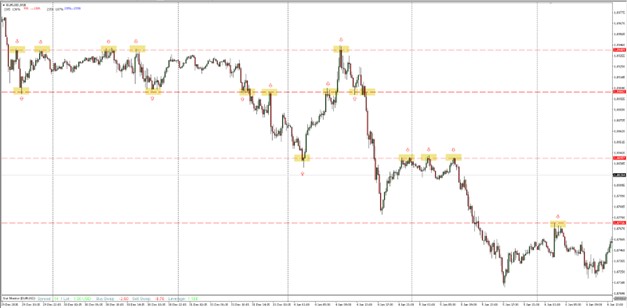
There are several methods to define S/R levels, including using candlestick highs/lows or drawing trendlines. However, the most effective method relies on identifying price reaction points.
Look for areas where the price has historically struggled to pass. The more times the price touches and rejects a level, the stronger that support or resistance becomes.
4. Visualizing Levels in Practice
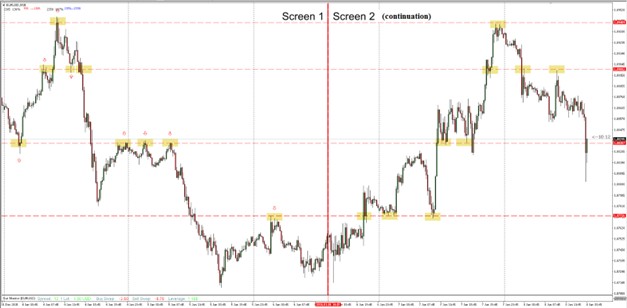
Charts often illustrate how markets respect certain levels and how roles reverse. As time progresses, stable zones emerge, typically showing equal spacing between support and resistance, creating a “ladder” effect.
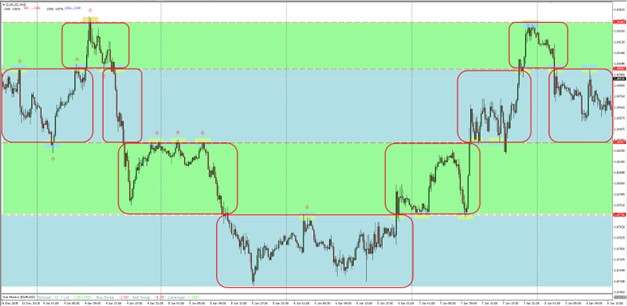
Moreover, the market often moves within “boxes” or zones. Once a box is broken, price may shift to another previously established level. Occasionally, a strong two-box impulse is followed by a correction, providing actionable signals.
5. Common Mistakes by Beginners
A frequent issue among novice traders is over-marking S/R levels, leading to a “messy” chart where it’s unclear which zones are truly relevant. Quality beats quantity.
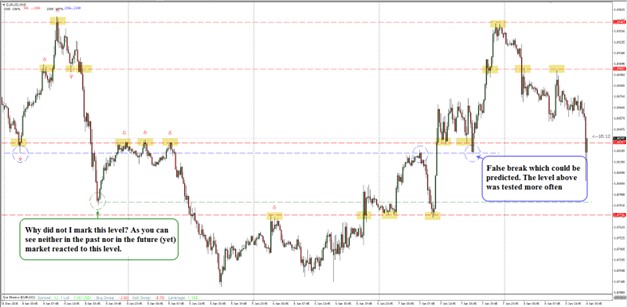
For example, in the comparison below:
- The Green Level lacks historical validation and is ultimately ignored by price action.
- The Blue Level has been tested multiple times in both directions, making it a reliable reference point.
Conclusion
Correctly identifying and applying support and resistance levels can significantly influence a trader’s success. These zones often prompt price reactions, offering high-probability setups. Mastering this skill can help minimize losses and amplify gains, especially when paired with box-based analysis.
Practice Drawing Levels.
Open a demo account and test your ability to spot key Support and Resistance zones risk-free.
Frequently Asked Questions
Does Support always become Resistance?
Not always, but very often. When a key support level is broken with momentum, the market psychology shifts, and traders who bought there are now trapped, creating selling pressure (resistance) if price returns.
What timeframe is best for S/R?
Higher timeframes (Daily, Weekly, H4) produce much more reliable levels than lower timeframes (M5, M1) because they represent significant capital flow.
How wide should a “zone” be?
It depends on volatility and timeframe. For a Daily chart, a zone might be 20-50 pips wide. The key is to cover the recent wicks and bodies where price reacted.
⚠️ Disclaimer: The content of this article is strictly for informational purposes and does not constitute investment advice. FXRebate is a cashback and affiliate service, not a broker or fund manager; responsibility for trades and funds lies exclusively with the third-party broker. Trading with leverage involves high risks of capital loss. Partner links used do not generate additional costs for you.