5 Methods for Identifying Trend Direction
⏱️ Estimated Reading Time: 5 minutes
📝 Summary: “The trend is your friend” is the golden rule of trading. This guide explores 5 distinct methods to identify market direction, from simple line charts to advanced indicators like ADX and Moving Averages.
Trend-based trading involves trading in the direction of market momentum. When the market trend is upward, seeking short opportunities is counterintuitive. Long positions are generally the safer alternative. Many amateur traders attempt to predict reversals, even when a strong trend has been in place for months. In doing so, they miss out on potential profits that could have been gained by aligning with the dominant trend.
Even if you are not a trend-following trader, understanding the directional bias is crucial. Markets move in three general directions: Uptrend, Downtrend, and Sideways (range-bound).
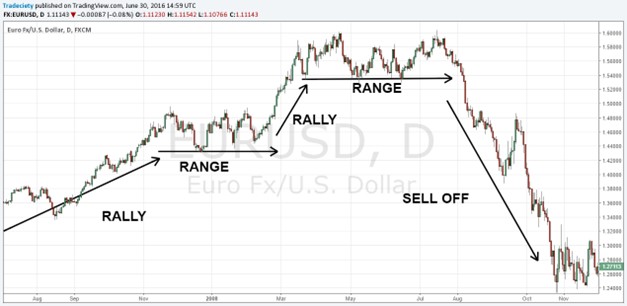
Table of Contents
1. Using a Line Graph
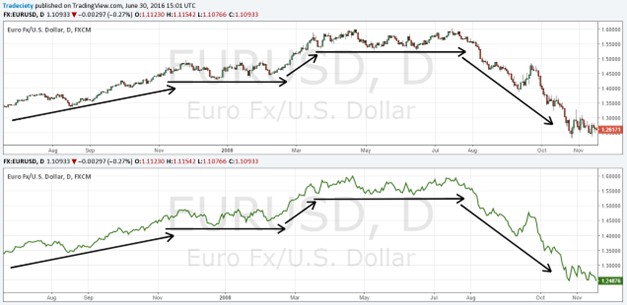
This is the simplest method. Most traders use candlestick or bar charts, which provide rich data but can be visually noisy. A Line Graph simplifies the view by plotting only the closing prices.
By switching to a Line Graph on a higher timeframe (like Daily or Weekly), the “noise” of wicks and intraday volatility disappears, leaving a clear, smoothed path of the price. If the line is moving from the bottom-left to the top-right, the trend is up.
2. Highs and Lows Analysis
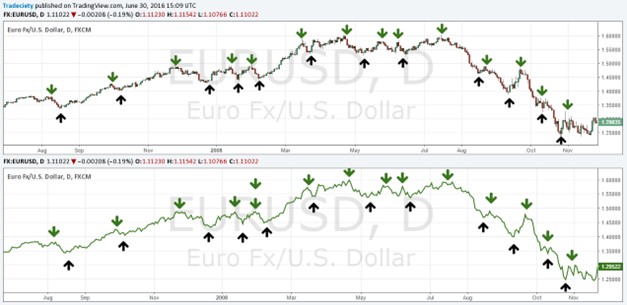
This is the classic definition of a trend according to Dow Theory. It requires no indicators, just price action.
- Uptrend: Defined by a series of Higher Highs (HH) and Higher Lows (HL).
- Downtrend: Defined by a series of Lower Highs (LH) and Lower Lows (LL).
As long as the price continues to make Higher Highs and Higher Lows, the uptrend is intact. A break in this sequence (e.g., making a Lower Low) is the first warning sign of a potential reversal.
3. Moving Averages Method
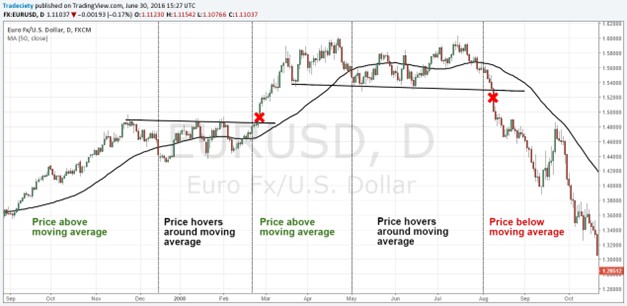
Moving averages are objective tools that smooth out price data to create a single flowing line. They act as dynamic support and resistance.
- Price > MA: Indicates an Uptrend (Look for buys).
- Price < MA: Indicates a Downtrend (Look for sells).
A common strategy is to use the 200-period Moving Average. If the price is above the 200 MA, the long-term trend is bullish. Traders often wait for the price to pull back to the Moving Average to enter a trade in the direction of the trend.
4. Trend Lines and Breakouts
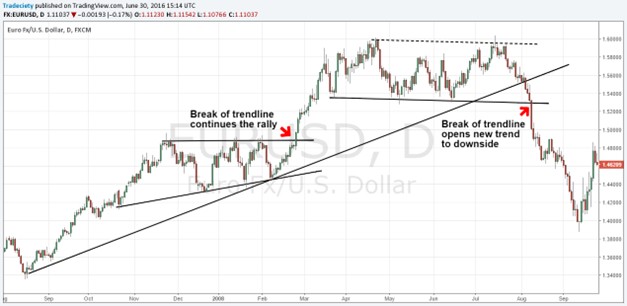
Drawing trendlines is an art that helps visualize the speed and direction of a trend. By connecting the swing lows in an uptrend (or swing highs in a downtrend), you create a visual barrier.
Trendlines serve two purposes:
- Support/Resistance: They indicate where the price might bounce.
- Breakout Confirmation: A clear break of a significant trendline often signals that the trend has ended or is pausing.
5. Using the ADX Indicator
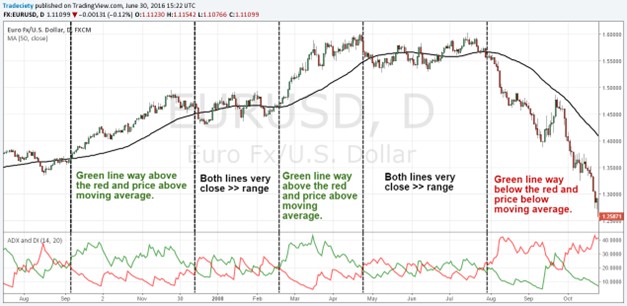
The ADX (Average Directional Index) is unique because it measures not just direction, but trend strength. It consists of three lines:
- +DI (Green): Bullish strength.
- -DI (Red): Bearish strength.
- ADX Line: Overall strength (values above 25 indicate a strong trend).
Interpretation: When the +DI crosses above the -DI, it signals an uptrend. If the ADX line is also rising, it confirms the trend is strong. This helps traders distinguish between a true trend and a choppy market.
Identify the Trend with Confidence.
Open a demo account and practice these 5 methods to spot the next big move.
Frequently Asked Questions
Which timeframe is best for identifying trends?
It depends on your trading style. However, the Daily (D1) chart is often considered the gold standard for determining the overall market direction, even if you trade on lower timeframes.
Can I use multiple methods together?
Yes! Combining methods (Confluence) increases reliability. For example, using Highs/Lows structure along with a 200 Moving Average provides a very robust trend signal.
What does a “Sideways” market look like?
A sideways market is characterized by approximately equal highs and equal lows (a range). Moving averages will be flat and intertwined with the price.
⚠️ Disclaimer: The content of this article is strictly for informational purposes and does not constitute investment advice. FXRebate is a cashback and affiliate service, not a broker or fund manager; responsibility for trades and funds lies exclusively with the third-party broker. Trading with leverage involves high risks of capital loss. Partner links used do not generate additional costs for you.