
8 Price Action Secrets Every Trader Should Know
⏱️ Estimated Reading Time: 6 minutes
📝 Summary: This article reveals eight critical price action secrets, explaining why zones beat levels, how to interpret candle shadows, and the importance of trading only in clear market contexts.
Price action is a foundational trading concept, and when applied correctly, it significantly enhances both performance and chart interpretation. However, widespread misinformation often leads traders to failure. This article outlines eight essential principles to master price action trading.
Table of Contents
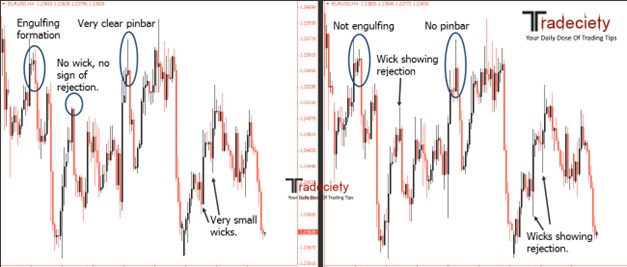
Key Takeaways
- Zones vs. Lines: Markets are dynamic; use zones to absorb volatility rather than precise lines.
- Context: A candlestick pattern is meaningless without the surrounding market context.
- Selection: Not all markets are worth trading. Avoid messy, range-bound pairs.
- Patience: Wait for price to reach key locations (support/demand) before acting.
1. Zones Over Levels
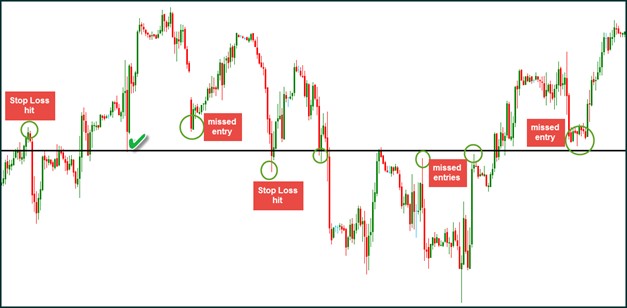
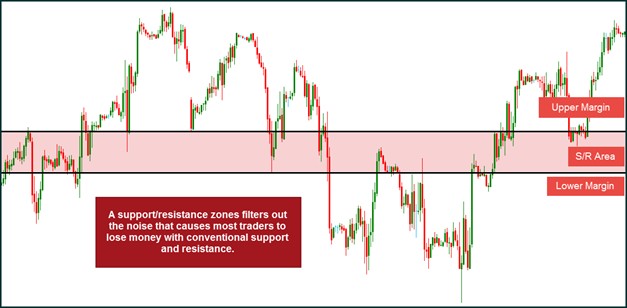
Support and resistance zones are more effective than rigid horizontal lines. Lines often fail in real-time trading, while zones help filter out volatility noise.
2. Focus on Highs and Lows
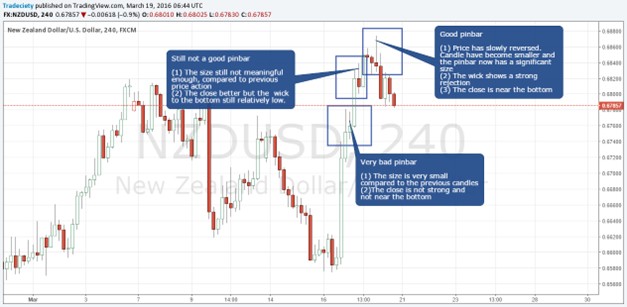
Highs and lows reveal trend strength and possible reversals. Patterns of failed higher highs or growing candle shadows signal momentum shifts.
3. Location Matters
The effectiveness of a price signal increases drastically when it appears at significant support or resistance levels. Contextual trading reduces stress and increases win rates.
4. Context is Everything
Price action must be interpreted relative to prior behavior. Candle patterns without context can be misleading.
5. Four Price Action Clues
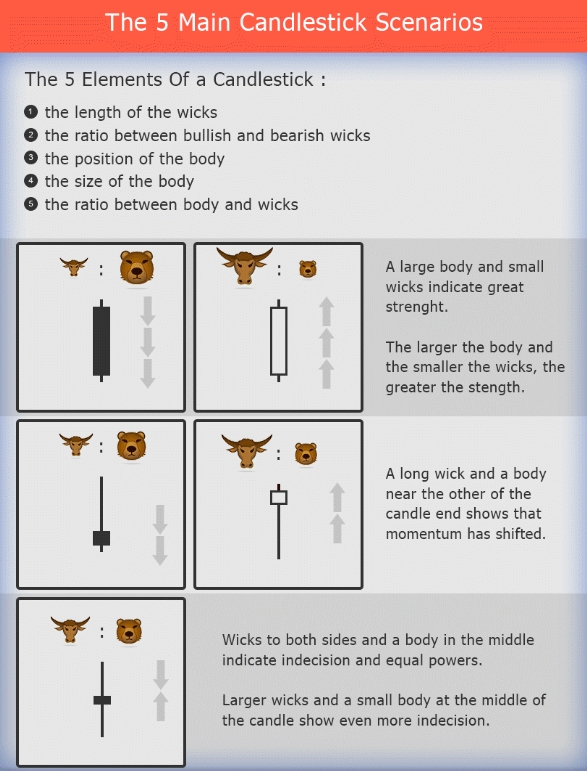
Understanding a candlestick goes beyond its color. Look for these four clues:
- Large shadows: Indicate uncertainty or rejection.
- Shadow position: Shows direction of pressure (e.g., long upper wick = selling pressure).
- Body position: Indicates conviction at the close.
- Body-to-shadow ratio: Reveals trend clarity versus indecision.
6. Broker Candle Timings Are Irrelevant
Slight differences due to broker time zones (e.g., GMT+2 vs GMT+3) do not affect long-term performance. Consistency is more important than exact candle closure time.
7. Amateur Squeezes and Stop Hunts
Common patterns attract amateurs. Professionals exploit this by triggering stops to increase liquidity. Wait for the squeeze to end or place wider stops to survive these moves.
8. Market Selection is Critical
Not all markets are equal. Focus on those showing clean price action and respect for technical levels. Avoid congested, unpredictable pairs even if they’re familiar.
Putting It All Together
Price action is not about memorizing patterns; it’s about reading the story the market is telling. By focusing on zones, context, and market selection, you can filter out the noise that traps amateur traders.
Ready to trade with clarity?
Open a trading account today and earn cashback on every trade you execute.
Frequently Asked Questions
Is price action better than indicators?
Price action offers a direct view of market psychology without lag. While indicators can be helpful, price action provides the “raw data” of buyer and seller behavior.
What timeframe is best for price action?
Higher timeframes (H4, Daily) produce more reliable price action signals than lower timeframes (M5, M15), which contain more market noise.
Do I need to wait for a candle to close?
Yes. A candle is not a signal until it closes. Price can reverse in the last few seconds of a candle’s life, invalidating a potential setup.
⚠️ Disclaimer: The content of this article is strictly for informational purposes and does not constitute investment advice. FXRebate is a cashback and affiliate service, not a broker or fund manager; responsibility for trades and funds lies exclusively with the third-party broker. Trading with leverage involves high risks of capital loss. Partner links used do not generate additional costs for you.