
How to Use the ATR Indicator: The Complete Volatility Guide
⏱️ Estimated Reading Time: 5 minutes
📝 Summary: The ATR (Average True Range) is the ultimate tool for measuring volatility. This guide explains the difference between momentum and volatility, how to identify turning points, and how to use the “ATR Stop” to stay in profitable trends.
The ATR (Average True Range) indicator is extremely popular but often misunderstood. Many traders confuse it with a directional indicator, when in reality, it is purely a barometer of volatility. This guide aims to clarify the concept and show you how ATR can become a universal tool in your trading strategy.
Table of Contents
1. How to Calculate ATR (Visually)
Instead of getting lost in complex mathematical formulas, it is vital to understand the logic behind the indicator. ATR essentially measures how much the price moves, on average, over a specific period.
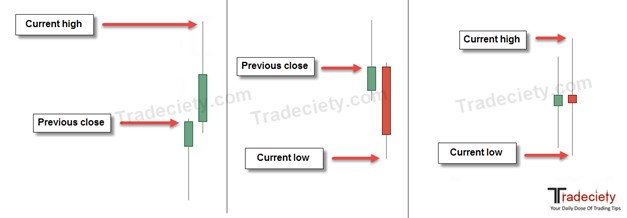
The calculation is based on the “True Range,” which considers:
- The distance between the current candle’s high and low.
- The distance between the previous close and the current high (in case of a gap up).
- The distance between the previous close and the current low (in case of a gap down).
2. Momentum vs. Volatility
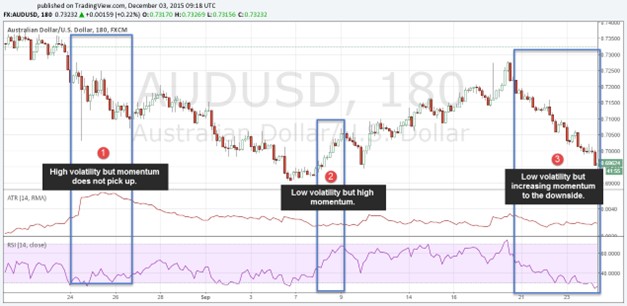
One of the biggest mistakes is associating volatility with direction. The ATR indicator evaluates only the degree of fluctuation, not the direction.
- Low Volatility: Small candles, price stagnates or moves slowly.
- High Volatility: Large candles, aggressive moves (whether buying or selling).
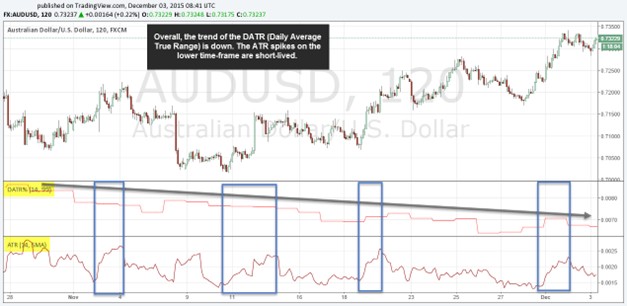
In the image below, notice how ATR rises when candles become larger, regardless of their color.
3. Market Analysis with ATR
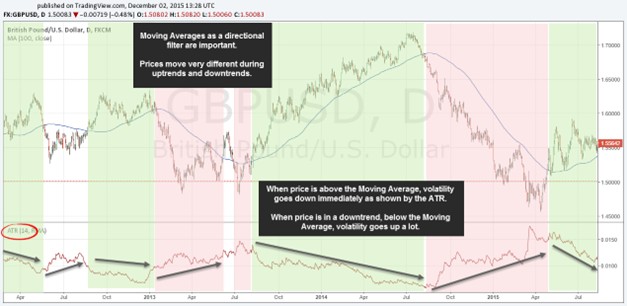
Financial markets are cyclical: periods of low volatility (consolidation) are invariably followed by periods of high volatility (expansion/trend).
ATR helps us identify the moment the market “wakes up.” A sudden spike in ATR value after a period of calm often signals the beginning of a new strong trend. Breakout traders use this signal to enter the market.
4. Trend Reversal Signals
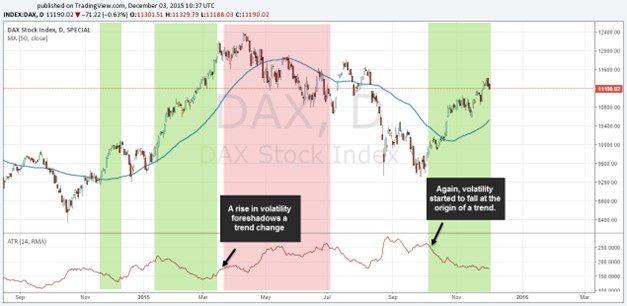
ATR can also function as a tool for identifying reversals. Why? Because a trend cannot sustain extreme volatility indefinitely.
When ATR reaches historical highs, it often indicates a market “climax” (panic selling or buying euphoria). This extreme volatility typically marks the exhaustion of the current trend and a potential major correction or reversal.
5. Dynamic Stop Loss Strategy
Placing a fixed Stop Loss (e.g., 20 pips) is often inefficient because it doesn’t account for market “noise.” In a volatile market, 20 pips can be hit instantly just from normal fluctuations.
Using ATR, you can set a Stop Loss adapted to current conditions:
- Calm Market (Low ATR): Tighter Stop Loss.
- Choppy Market (High ATR): Wider Stop Loss to let the price “breathe.”
A common rule is placing the Stop Loss at a distance of 2 x ATR or 3 x ATR from the entry point.
6. The “Volatility Stop” Indicator
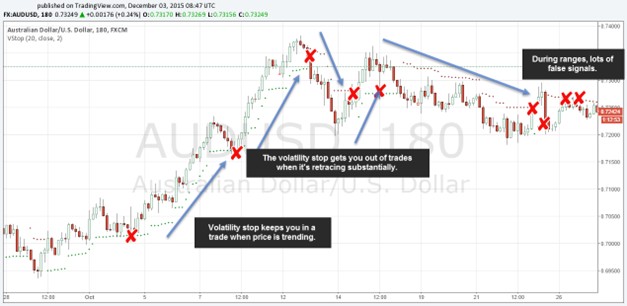
Some traders use a visual variation of the ATR concept called “Volatility Stop” or “Chandelier Stop” (represented by green or red dots on the chart). It works like an automatic Trailing Stop.
The indicator adjusts the exit level as the price moves in your favor. It keeps you in the market during strong trend phases and takes you out only when the price reverses significantly (exceeding average volatility).
7. Filtering with Moving Averages
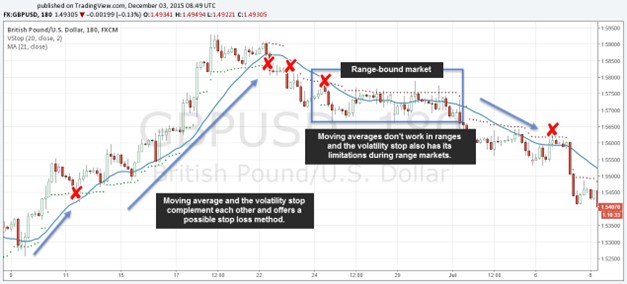
Since Volatility Stop is a trend-following indicator, it can generate false signals in sideways markets (ranging). To avoid this, combine it with a Moving Average.
Simple Rule:
Consider buy signals from Volatility Stop ONLY if the price is above the Moving Average. If the price is below the average, ignore buy signals and wait for sell opportunities.
Test the ATR Strategy Risk-Free.
Open a demo account and practice setting dynamic Stop Losses with ATR.
Frequently Asked Questions
What period should I use for ATR?
The standard setting is 14 periods (e.g., the last 14 days on Daily). For intraday trading (scalping), some traders prefer shorter periods, such as 7 or 9, for a faster reaction.
Can I use ATR for Take Profit?
Yes. ATR helps assess profit potential. If volatility is high, you can set more ambitious profit targets. If ATR is low, expect smaller moves and adjust your Take Profit accordingly.
Does ATR work on Crypto?
Absolutely. In fact, ATR is even more useful in Crypto markets due to their extreme volatility, helping you avoid premature exits from trades.
⚠️ Disclaimer: The content of this article is strictly for informational purposes and does not constitute investment advice. FXRebate is a cashback and affiliate service, not a broker or fund manager; responsibility for trades and funds lies exclusively with the third-party broker. Trading with leverage involves high risks of capital loss. Partner links used do not generate additional costs for you.