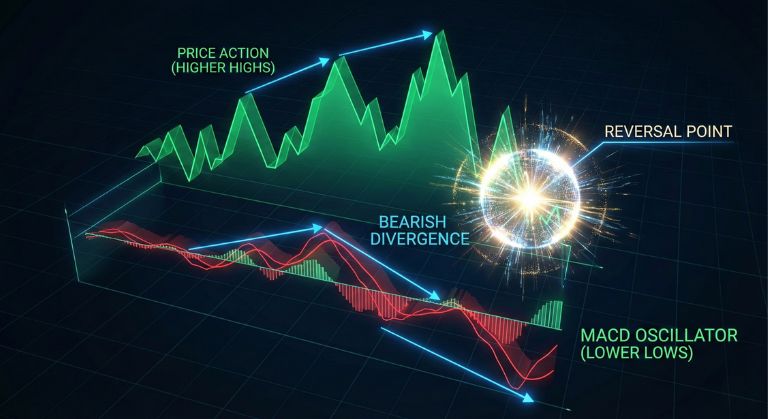
Double Divergence – An Important Concept in Trading
⏱️ Estimated Reading Time: 4 minutes
📝 Summary: This advanced technical analysis guide explains the concept of “Double Divergence” using the MACD indicator, demonstrating how to identify weakening trend momentum and spot high-probability reversal setups.
Identifying momentum shifts and establishing the true end of a trend can be challenging. Many traders rely on standard divergences, but these often lead to false signals in strong trends. This article introduces a more robust concept: Double Divergence. By waiting for a second confirmation of momentum loss, traders can significantly increase the accuracy of their entries.
Table of Contents
Key Takeaways
- Standard Flaw: A single divergence often indicates a pause, not a reversal.
- Double Strength: Two consecutive divergences signal a critical loss of momentum.
- Visual Aid: The MACD histogram is the ideal tool for spotting these discrepancies.
- Patience: Waiting for the second divergence filters out premature entries.
1. A Brief Recap: Standard Divergence
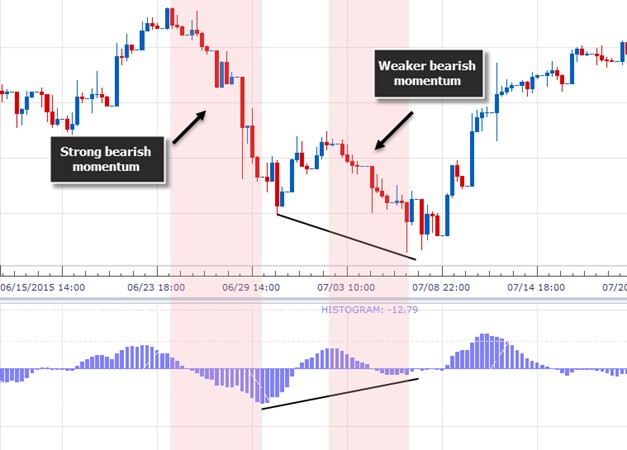
A divergence occurs when the price action and a momentum indicator (like the MACD) disagree. For example, the price makes a Lower Low, but the MACD histogram makes a Higher Low.
This indicates that while sellers are still pushing price down, the intensity or momentum of that push is fading. However, a single divergence is often just a consolidation signal, not a full reversal signal.
2. What is Double Divergence?
The “Double Divergence” is a filtering mechanism designed to increase trade accuracy. Since trends can persist longer than expected, the first divergence often results in a loss or a small retracement.
Definition: Double divergence occurs when the price makes a series of three peaks (or troughs), resulting in two consecutive divergent signals on the MACD. This signals the imminent end of a trend with much greater reliability than a standard divergence.
3. Real Chart Examples
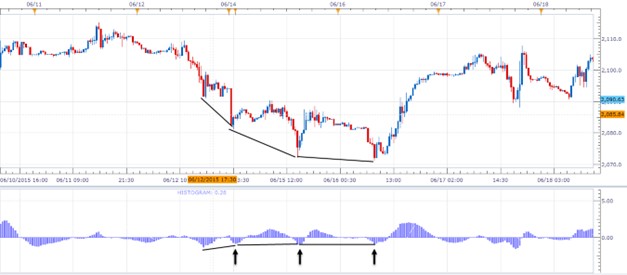
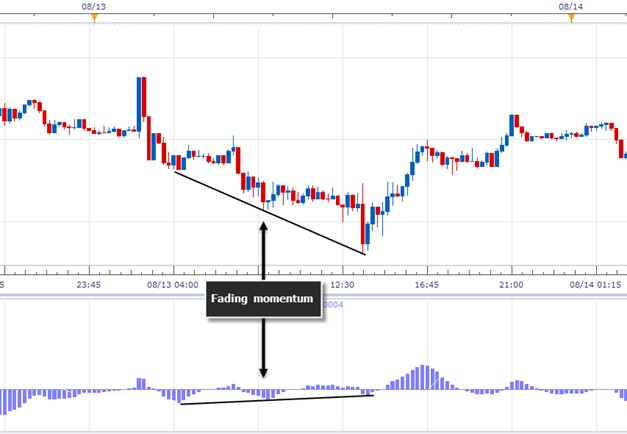
Let’s analyze a scenario where a simple divergence failed. Initially, the price made a lower low with less momentum (divergence), but instead of reversing, it continued to drop. Subsequently, the MACD formed another higher low while price made a third push down.
This second signal—the double divergence—marked the true bottom where buyers finally took control.
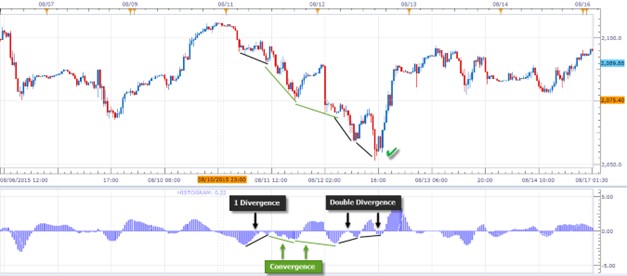
Another variation occurs when the trend doesn’t make sharp new lows but grinds slowly downward. The MACD will display rising lows (green lines), signaling a gradual but persistent loss of bearish momentum.
4. Why Use This Strategy?
Trading solely based on divergences can be risky. However, using the Double Divergence concept acts as a powerful filter. It prevents you from picking tops or bottoms too early and forces you to wait until the trend is truly exhausted. Combined with price action confirmation, this is a robust model for reversal traders.
Spot the reversal before it happens.
Apply the Double Divergence strategy on a live account and earn cashback on your volume.
Frequently Asked Questions
What indicator is best for spotting divergence?
The MACD (Moving Average Convergence Divergence) histogram is widely considered the clearest tool for visualizing momentum differences, though RSI and Stochastic can also be used.
Does double divergence guarantee a reversal?
No signal guarantees a reversal. Double divergence indicates a high probability that momentum is exhausted, but it should always be combined with price action confirmation (like a break of structure).
Can I use this on any timeframe?
Yes, the concept applies to all timeframes. However, divergences on higher timeframes (H4, Daily) are generally more reliable and lead to larger moves than those on M5 or M15.
⚠️ Disclaimer: The content of this article is strictly for informational purposes and does not constitute investment advice. FXRebate is a cashback and affiliate service, not a broker or fund manager; responsibility for trades and funds lies exclusively with the third-party broker. Trading with leverage involves high risks of capital loss. Partner links used do not generate additional costs for you.