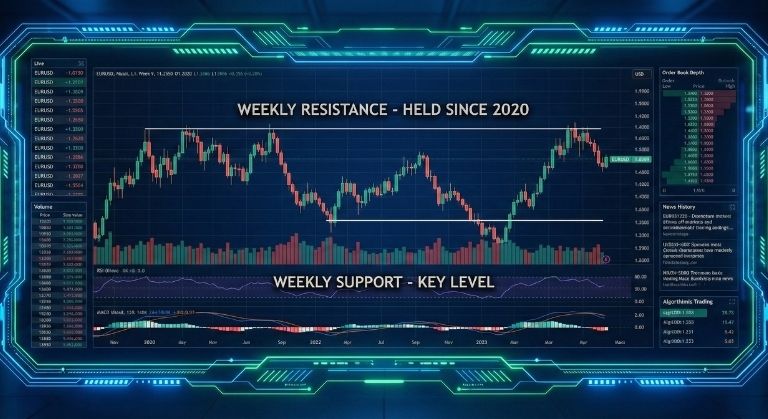
Weekly S/R Strategy for EUR/USD: A Multi-Timeframe Approach
⏱️ Estimated Reading Time: 10 minutes
📝 Summary: This advanced strategy uses Weekly candlesticks to define strong Support/Resistance zones, refines them on the H4 timeframe, and executes trades on M30. It relies on specific candle configurations and strict risk management rules.
Trading EUR/USD effectively requires a top-down approach. The Weekly S/R Strategy described here is designed to capture significant moves by identifying the dominant directional bias on the Weekly chart and executing with precision on lower timeframes. It focuses on the relationship between consecutive candlesticks to draw highly accurate zones.
Table of Contents
1. Weekly Chart Framework
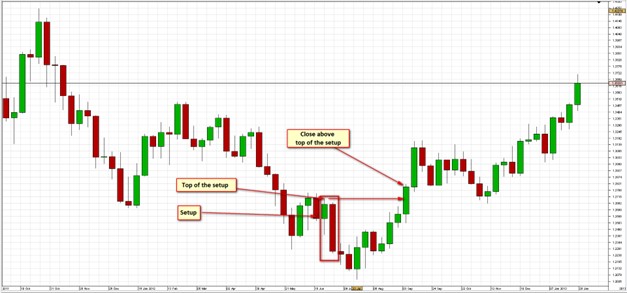
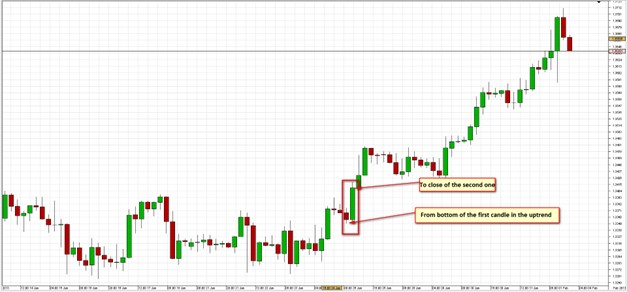
The strategy begins with an analysis of the weekly candlestick chart. The core principle involves evaluating two consecutive candlesticks to define the broader directional bias. The size of the candlesticks is irrelevant; what matters is their directional continuity—specifically, the closing price of the second candle must be either above or below the high or low of the first.
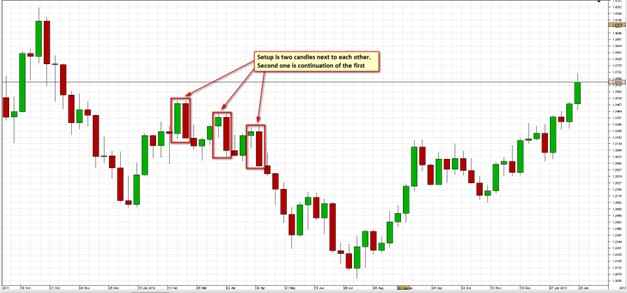
Once such a relationship is identified, we draw a horizontal level (line) and buffer it with a 20-pip tolerance zone, which serves as a potential entry area.
2. Candlestick Configurations
Drawing the levels correctly depends on the shape of the candles. There are three specific scenarios:
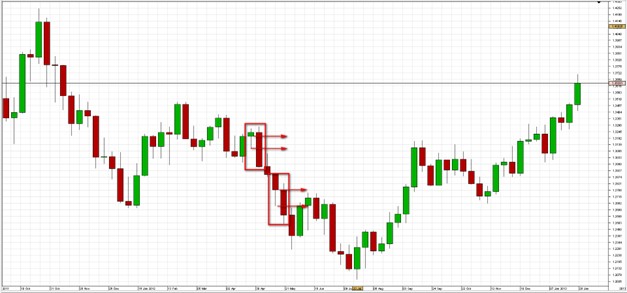
Scenario A: Small Body, Long Wicks
If the first candle has a small body and long wicks, levels are placed within the shadows and body of the first candle.
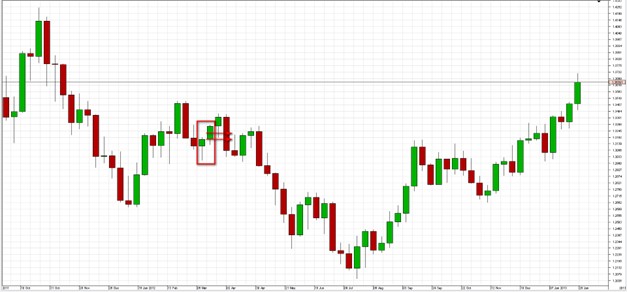
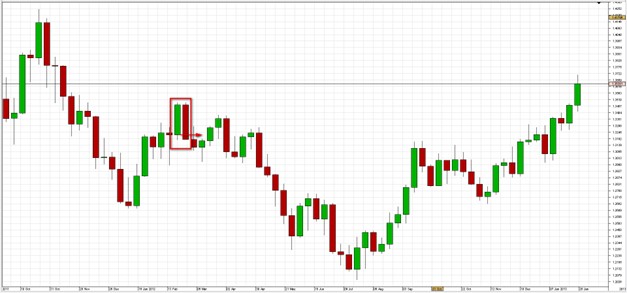
Scenario B: Overlap / Indecision
If the first candle has both a small body and small shadows, the levels are drawn within the body of the first and the middle of the second candle. If the candles intersect or overlap significantly, suggesting indecision, levels are placed only on the body of the first candle.
Scenario C: Long Body Second Candle
If the second candle has a long body, then three levels are drawn:
- One on the body of the first candle
- One on the wick of the first candle
- One in the midsection of the second candle
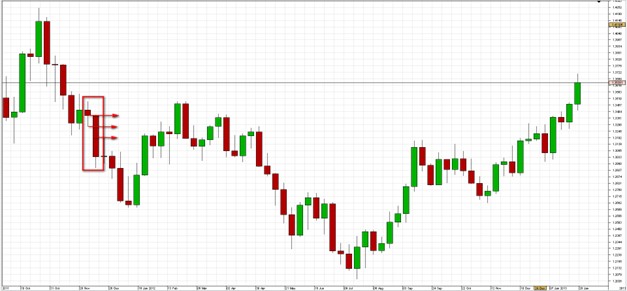
Each identified candlestick zone should be expanded with a 20-pip buffer to define an actionable zone for trade entries. This creates a high-probability area for potential market reactions.
3. H4 Refinement Rules
After defining the Weekly zones, we move to the H4 timeframe to validate the setup.
H4 Formation Rules:
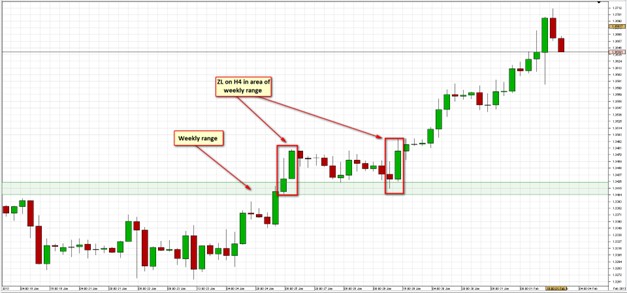
- If the body of the second candle on H4 is at least twice the size of the preceding candle’s body, levels should be drawn following the same rules as on the weekly chart.
- The H4 formation must have a minimum range of 30 pips.
- The formation is considered valid for up to one month, unless invalidated by the same principle as the weekly chart.
4. Trade Execution and Management
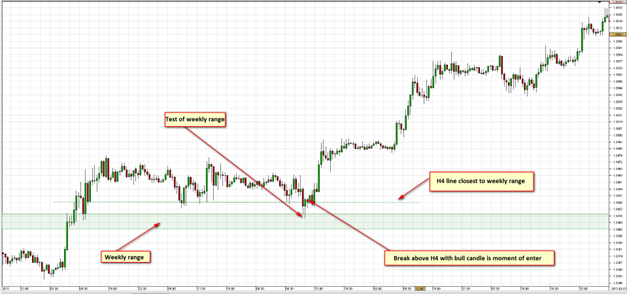
Once the weekly and H4 zones are defined, a Zero Line (ZL) is identified on the H4 chart—this is the point where profit/loss is neutral.
Trade entries are executed on the M30 timeframe after:
- A weekly zone is tested.
- The ZL is broken by a bullish or bearish candle on H4.
Proximity to the weekly zone is critical—entries must be as close as possible to it. The system emphasizes recency and proximity; the newer and closer a signal is to the key zone, the higher the priority it holds.
5. Risk and Exit Management
This strategy employs strict rules to protect capital:
- Stop Loss (SL): Set at exactly 25 pips.
- Break-even (BE): Triggered after the position gains more than 50 pips.
There are three primary exit strategies:
- Fixed Take Profit (TP): Set at 250 pips.
- Reversal Zone Closure: If a new weekly zone opposite to the trade direction forms, and the price reaches this zone while the position has a 175-pip gain, the position is closed.
- Wave Structure Exit: If the trade aligns with a completed wave structure, close at ~175 pips profit.
Test the Weekly S/R Strategy.
Practice drawing these levels on a risk-free demo account before trading live.
Frequently Asked Questions
Why use the Weekly chart for entry zones?
Weekly charts filter out market noise and reveal the dominant order flow from institutional traders, making the support and resistance zones significantly more reliable.
Can I use a larger Stop Loss than 25 pips?
The strategy is designed for precision. A 25-pip SL ensures a high Risk:Reward ratio. If you need a larger SL, it usually means your entry point was not close enough to the Weekly zone.
Does this strategy work on other pairs?
While optimized for EUR/USD due to its liquidity, the principles of candlestick continuity and multi-timeframe analysis apply to other major pairs like GBP/USD or AUD/USD.
⚠️ Disclaimer: The content of this article is strictly for informational purposes and does not constitute investment advice. FXRebate is a cashback and affiliate service, not a broker or fund manager; responsibility for trades and funds lies exclusively with the third-party broker. Trading with leverage involves high risks of capital loss. Partner links used do not generate additional costs for you.