
Trading Based on Harmonic Patterns: The Most Effective Models
⏱️ Estimated Reading Time: 6 minutes
📝 Summary: This advanced technical guide details the most effective harmonic trading models used by Peter Drabik, providing the exact Fibonacci measurements required to identify valid ABCD, Gartley, Butterfly, Bat, and Crab patterns.
Harmonic trading combines geometric price patterns with Fibonacci numbers to identify precise turning points in the market. Unlike basic chart patterns, harmonics require specific mathematical ratios to be valid. This guide details the system used by Peter Drabik, focusing on high-probability setups with a Risk/Reward ratio of 3:1.
Table of Contents
Key Takeaways
- Precision: Harmonic patterns must adhere to strict Fibonacci ratios; “close enough” is not valid.
- Key Levels: The most critical retracements are 61.8% (Gartley) and 78.6% (Butterfly/Gartley).
- D Point: This is the execution zone[cite: 10]. Wait for a price action signal at Point D before entering.
- Risk/Reward: This strategy targets a minimum R:R of 3:1[cite: 9].
[cite_start]
[cite_start]
1. Strategy Rules & Fibonacci Levels
[cite_start]
To trade harmonics successfully, you must configure your Fibonacci tool with specific levels[cite: 6].
-
[cite_start]
- Internal Retracements: 0.236, 0.382, 0.5, 0.618, 0.786, 0.886[cite: 7].
- External Retracements (Extensions): 1.272, 1.5, 1.618, 2.0, 2.618[cite: 8].
[cite_start]
The pattern should ideally align with the main trend. [cite_start]Point “D” serves as the entry zone, confirmed by a candlestick pattern[cite: 10].
2. The ABCD Pattern
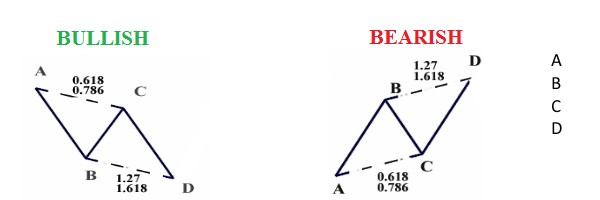
The ABCD pattern is the foundation of all harmonic trading. [cite_start]It is essentially a measured move where the leg AB is equal in length and time to the leg CD[cite: 12]. [cite_start]In Elliott Wave theory, this is often the ABC correction[cite: 13].
Structure: Price moves from A to B, retraces to C, and then extends to D. A valid buy/sell signal occurs at D.
[cite_start]
3. The Gartley Pattern
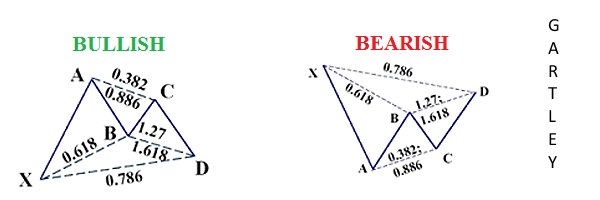
Introduced by H.M. [cite_start]Gartley in 1935, this is the original “XABCD” pattern[cite: 17]. It resembles a “W” (Bullish) or “M” (Bearish).
-
[cite_start]
- Point B: Must touch the 61.8% retracement of leg XA[cite: 17].
- Point D: Must touch the 78.6% retracement of leg XA[cite: 17].
- Symmetry: Ideally, AB equals CD[cite: 18].
[cite_start]
[cite_start]
4. The Butterfly Pattern
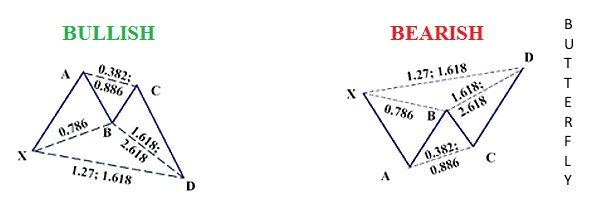
The Butterfly is an extension pattern, meaning point D moves beyond the starting point X. It is often used to catch trend reversals at new highs or lows.
-
[cite_start]
- Point B: Must be at a 78.6% retracement of XA[cite: 21].
- Point D: Typically extends to 127% or 161.8% of the XA leg.
5. The Bat Pattern
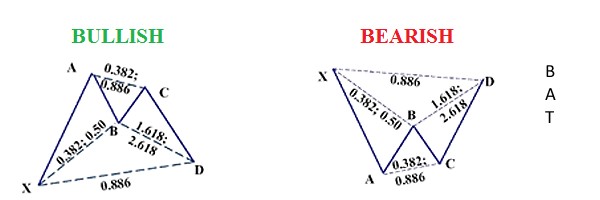
The Bat pattern is known for its high accuracy. It looks similar to a Gartley but has different internal ratios.
-
[cite_start]
- Point B: Typically between 38.2% and 50% of XA[cite: 24].
- Point D: Must execute precisely at the 88.6% retracement of XA[cite: 23].
[cite_start]
6. The Crab Pattern
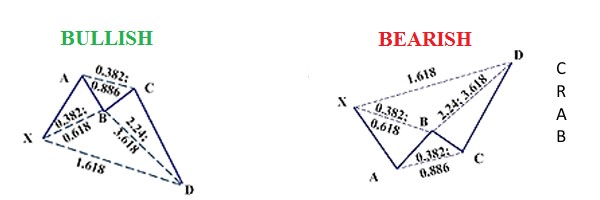
The Crab is considered one of the most volatile but powerful patterns. It implies an extreme price extension.
-
[cite_start]
- Point B: Can vary between 38.2% and 61.8%[cite: 27].
- Point D: This is the defining feature—it extends to a massive 161.8% of the XA leg[cite: 26].
[cite_start]
Trade with geometric precision.
Identify Harmonic patterns on our advanced charts and earn cashback on every trade.
Frequently Asked Questions
What happens if the ratios are not exact?
Harmonic trading relies on precision. If the retracement is significantly off (e.g., hitting 50% instead of 61.8%), the pattern is less reliable or invalid. However, a small buffer (e.g., +/- 5 pips) is often acceptable.
Do I need to calculate these manually?
No. Most modern trading platforms (like MT4, MT5, or TradingView) have built-in drawing tools specifically for XABCD patterns that measure the ratios automatically.
Where should I place my Stop Loss?
The Stop Loss is typically placed just beyond the “X” point (the start of the pattern) or beyond the next significant Fibonacci extension level (e.g., 113% or 127%).
⚠️ Disclaimer: The content of this article is strictly for informational purposes and does not constitute investment advice. FXRebate is a cashback and affiliate service, not a broker or fund manager; responsibility for trades and funds lies exclusively with the third-party broker. Trading with leverage involves high risks of capital loss. Partner links used do not generate additional costs for you.