How to Trade Supply and Demand Zones: The Ultimate Guide
⏱️ Estimated Reading Time: 12 minutes
📝 Summary: The difference between Supply/Demand and Support/Resistance is subtle but critical. This guide explains Order Flow mechanics, debunks the myth of “tested levels getting stronger,” and provides visual examples for high-probability setups.
The distinction between Supply & Demand and classic Support/Resistance might appear minor at first glance, but understanding it separates professional traders from amateurs. Traders who master supply and demand dynamics understand why price moves, not just where it might stop.
Table of Contents
1. Fundamentals of Supply and Demand
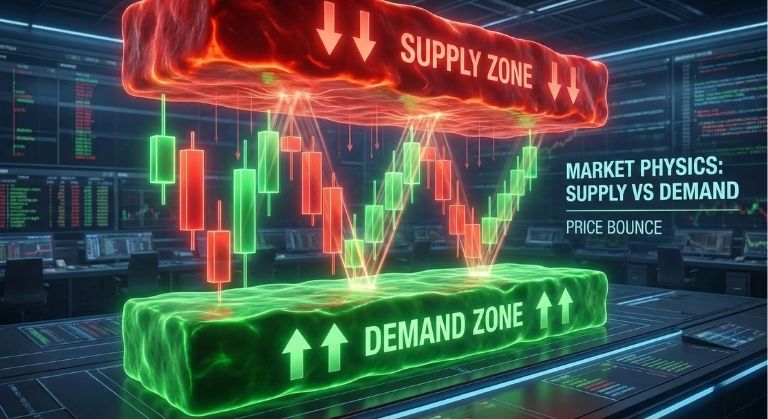
Supply & Demand analysis offers a direct window into market psychology. On any chart, there are distinct zones where the imbalance between buyers and sellers is obvious. These zones, called Demand (buying interest) and Supply (selling pressure), are where “Smart Money” (institutions) have left unexecuted orders.
2. Order Absorption: Why Tested Levels Weaken
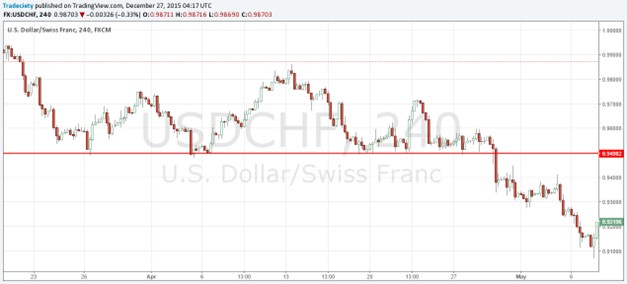
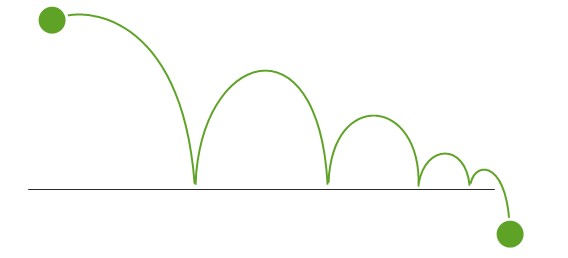
A common trading myth is: “The more times a support level is tested, the stronger it becomes.” This is only partially true and often dangerous.
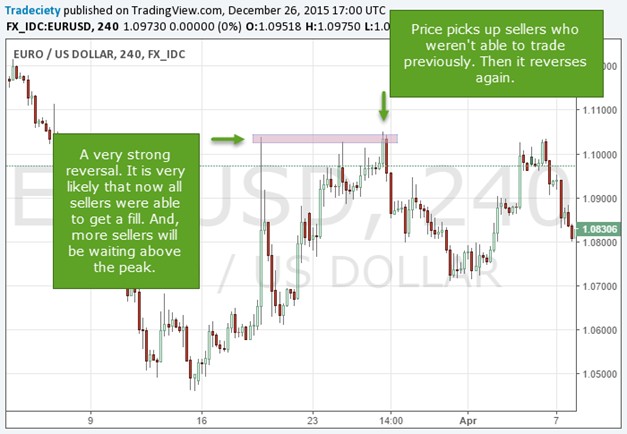
The Reality: Think of a support level as a stack of buy orders. Every time price touches that level, some buy orders are executed (consumed). The more often the level is hit, the fewer orders remain. Eventually, the stack of buyers is depleted (absorption), and price breaks through the level.
3. Zone Identification Patterns
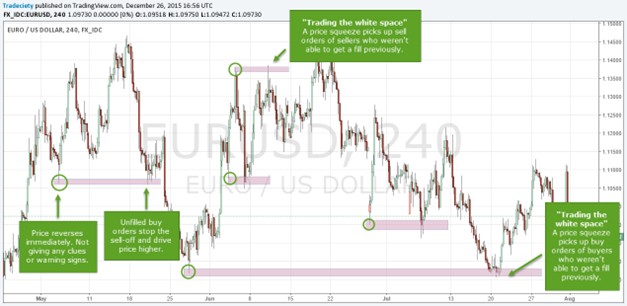
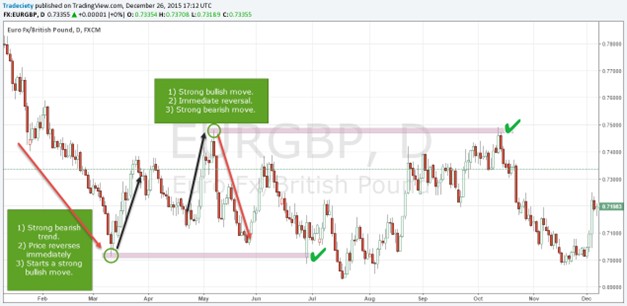
Supply and Demand zones typically form through four distinct price movement patterns, involving a “Base” (consolidation) followed by an explosive move:
- Rally-Base-Drop (RBD): Price rises, consolidates, then drops sharply (Supply).
- Drop-Base-Rally (DBR): Price drops, consolidates, then rises explosively (Demand).
- Rally-Base-Rally (RBR): Uptrend continuation.
- Drop-Base-Drop (DBD): Downtrend continuation.
4. Market Entry Types
How do we trade these zones? There are two main approaches:
- Aggressive Entry (Limit Orders): Place a “Set and Forget” order at the edge of the zone. The advantage is precision; the disadvantage is the risk of price slicing through the zone without reaction.
- Conservative Entry (Confirmation): Wait for price to enter the zone and show rejection signs (e.g., a Pin Bar or Engulfing) on a lower timeframe.
5. Fractality and Timeframes
This strategy is universal. A demand zone on the Daily chart (D1) looks exactly the same as one on the 5-minute chart (M5). However, the market’s “Matryoshka doll” nature means an H1 zone is just a small part of a larger D1 move.
Golden Rule: Trade in the direction of the higher timeframe zones.
6. Visual Examples: Valid vs. Invalid
Not all zones are created equal. The difference between a winning and losing trade often lies in the quality of the zone.
✅ Valid Setups (Strong Zones)
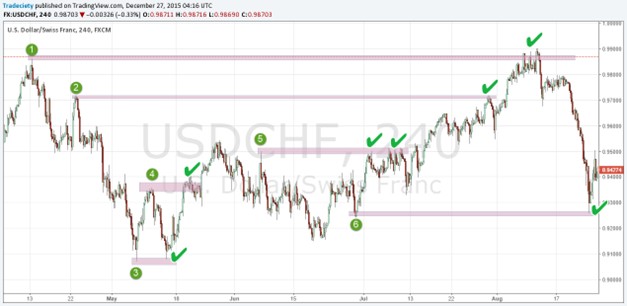
A strong zone has three key characteristics:
- Strong Initial Move: Price left the zone with large, explosive candles.
- Short Time in Zone: Price didn’t linger long at the “Base” (major imbalance).
- Freshness: The zone hasn’t been tested yet (or rarely tested).
❌ Invalid Setups (Weak Zones)
Avoid zones where:
- Price left slowly, with small candles.
- Price spent a lot of time consolidating before leaving.
- The zone has already been tested multiple times (advanced absorption).
Identify “Smart Money” Zones.
Open a demo account and practice identifying RBD and DBR zones risk-free.
Frequently Asked Questions
What is the difference between Supply/Demand and Support/Resistance?
Support and Resistance are lines where price reacted in the past. Supply and Demand are origin zones of violent moves, where unexecuted institutional orders (imbalance) exist.
What does a “Fresh” zone mean?
A zone is considered “Fresh” if price hasn’t returned to test it since its formation. These zones have the highest probability of success.
Can I use this strategy on Crypto?
Yes, supply and demand principles are universal and apply to any liquid market, including Forex, Stocks, and Cryptocurrencies.
⚠️ Disclaimer: The content of this article is strictly for informational purposes and does not constitute investment advice. FXRebate is a cashback and affiliate service, not a broker or fund manager; responsibility for trades and funds lies exclusively with the third-party broker. Trading with leverage involves high risks of capital loss. Partner links used do not generate additional costs for you.