
Box Theory in Trading: Mastering Consolidations
⏱️ Estimated Reading Time: 8 minutes
📝 Summary: This guide explores the “Box Theory”—a powerful method to identify market consolidations. Learn how to map price corrections, calculate box proportions, and combine this technique with Fibonacci and Trendlines for high-probability setups.
In a previous article, titled “Support and Resistance Are Crucial for Reading Markets”, the concept of box theory was briefly introduced. Due to the high level of interest and subsequent questions, this article delves deeper into understanding and applying the box theory in trading.
Table of Contents
1. What Are Boxes in Trading?
A box represents a time-based correction in the market. Broadly, there are two types of corrections:
- Price Corrections: These occur when the price moves against the prevailing trend (e.g., a dip in an uptrend). They often display wave-like formations.
- Time Corrections (Consolidations): Here, the price moves sideways with little directional bias, reflecting a temporary pause or balance between supply and demand. There are no distinct waves, and corrections appear flat.
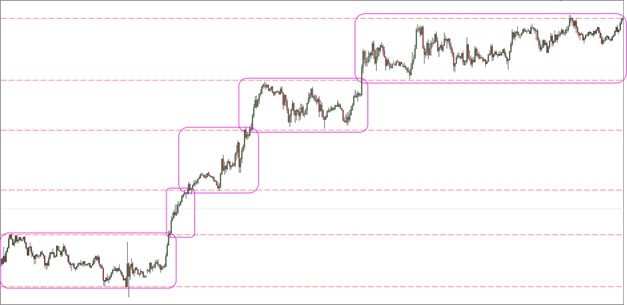
Boxes represent these consolidation zones—intermediate phases between price impulses, observable across short or long timeframes. Their main advantage is offering trading opportunities in both trend-following and countertrend strategies.
Price typically moves from one box to the next during an impulse phase.
2. Box Proportions and Breakout Strategy
Boxes are often overlapping or closely aligned. To identify a breakout level, shift the box range to align with the most recent price impulse.
Though a 1:1 ratio (height of box = length of impulse) is a standard assumption, variations occur frequently. Notably, some boxes mirror prior price action (so-called “mirror reflections”).
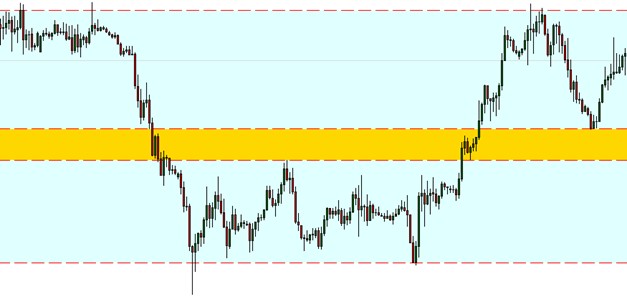
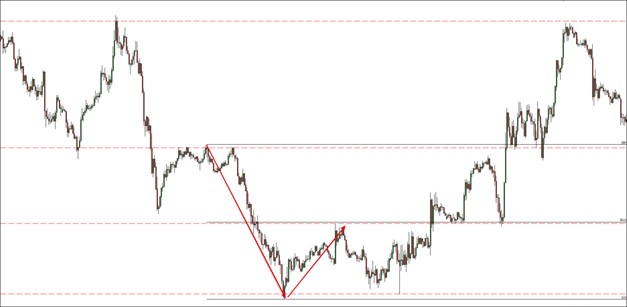
Strong impulses often span twice the box size, while corrections tend to stay within a single box. This aligns with the 50% Fibonacci retracement level, which serves as a favorable entry point.
3. Integrating Box Theory with Other Tools
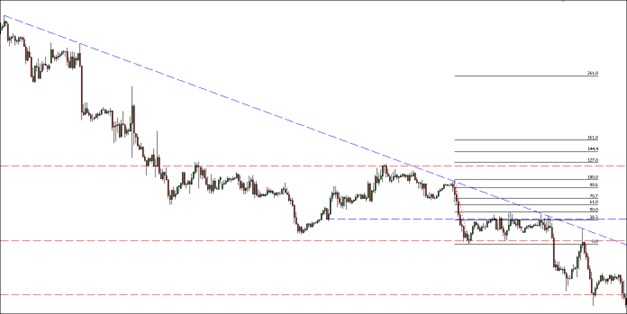
To enhance box analysis, professional traders rarely use it in isolation. They combine it with:
- Support and Resistance Levels
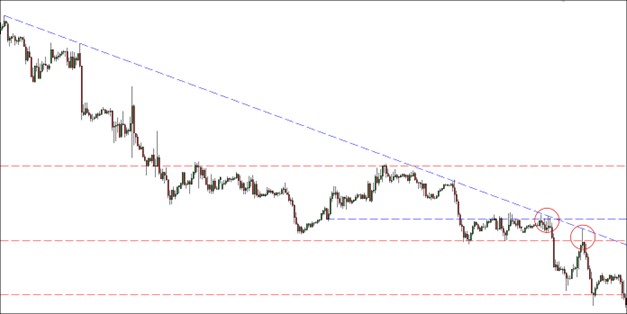
- Trendlines
- Fibonacci Levels: Most relevant are 38.2%, 50%, 61.8%, and 70.7%.
Momentum Oscillators
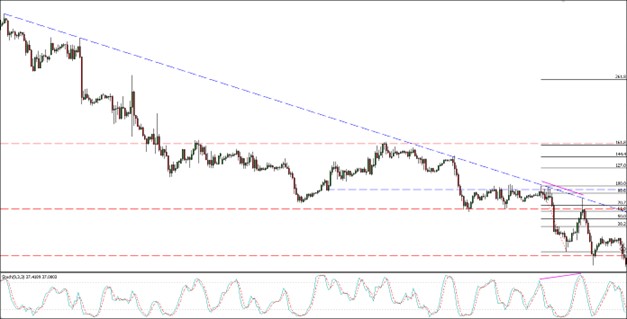
Indicators such as RSI, MACD, or Stochastic can provide confirmation. When these indicators diverge from price near a box boundary, it adds further decision-making clarity.
📌 Example: When multiple indicators (e.g., Fibonacci, trendline resistance, Stochastic divergence) align near a box boundary, the probability of a successful trade increases substantially.
4. Practical Scenarios
Bearish Scenario
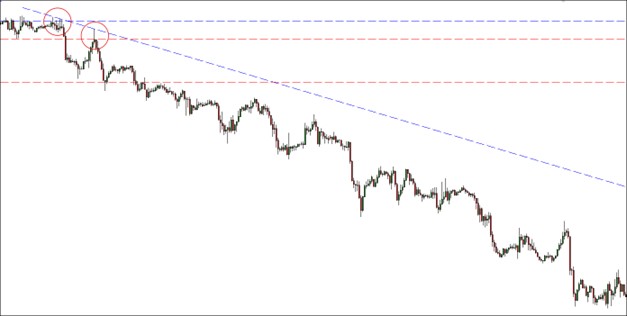
In a bearish scenario, if the price reacts to the top of a box near a trendline and retracement levels, a short position becomes attractive.
Bullish Scenario
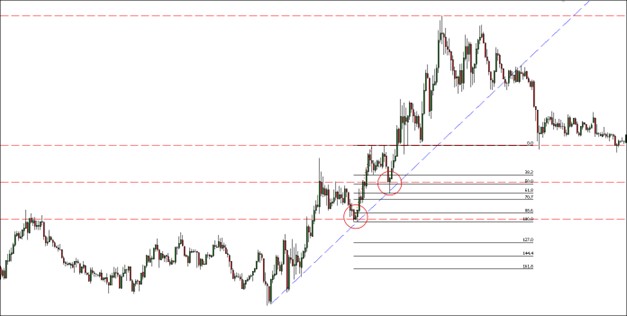
Conversely, in a bullish trend, price rejection from a box’s lower boundary, reinforced by Fibonacci 50% or 61.8% levels and trendline support, suggests a long opportunity.
Final Thoughts
Box theory is a powerful yet simple trading concept. It helps identify directional bias, key price zones (targets and entries), and increases trading certainty when validating setups.
Mastering the box theory is a fundamental step toward professional-level technical analysis. By avoiding noise and focusing on actionable zones, you can significantly improve your trading performance.
Master the Box Theory Risk-Free.
Open a demo account with a top-tier broker and practice identifying consolidation boxes today.
Frequently Asked Questions
What is the ideal timeframe for Box Theory?
Box theory works on all timeframes, as the market is fractal. However, H1, H4, and Daily charts often provide the most reliable signals for swing trading.
How do I define the box boundaries?
Mark the highs and lows of the consolidation range. The price should bounce between these levels multiple times before breaking out.
Is Box Theory better than Trendlines?
Neither is “better”; they complement each other. Boxes are superior for horizontal ranges, while trendlines excel in angled trends. Combining them yields the best results.
⚠️ Disclaimer: The content of this article is strictly for informational purposes and does not constitute investment advice. FXRebate is a cashback and affiliate service, not a broker or fund manager; responsibility for trades and funds lies exclusively with the third-party broker. Trading with leverage involves high risks of capital loss. Partner links used do not generate additional costs for you.