
Elliott Wave Theory: A Practical Trading Guide
⏱️ Estimated Reading Time: 12 minutes
📝 Summary: This guide simplifies the Elliott Wave Theory into a practical trading system. It covers the 5-wave impulse, specific tools for identification (AO, DMA), ZigZag vs. Irregular corrections, and a 4-step execution strategy.
Many beginners who come across the Elliott Wave Theory encounter difficulties in translating its principles into practical application. A key challenge lies in the numerous possible interpretations when identifying wave structures, compounded by the fact that market movements only follow ideal wave patterns for relatively short periods.
This document consolidates essential knowledge required to apply Elliott Wave Theory effectively within a trading system. Rather than offering a complete theoretical overview, it focuses on practical elements that help beginners grasp the core concepts and use them efficiently.
Table of Contents
1. Basic Concepts & Impulse Rules
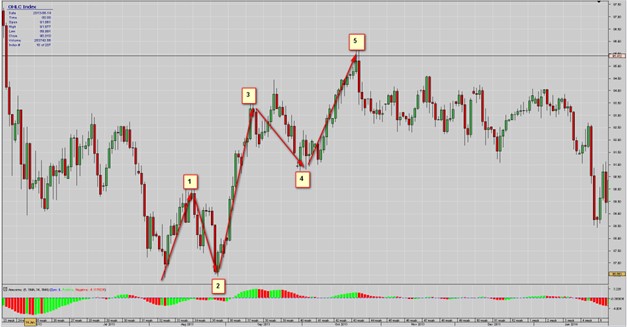
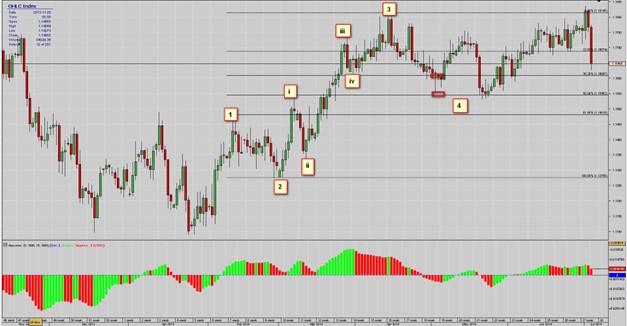
According to Elliott Wave Theory, financial markets move in repetitive wave patterns: a 5-wave impulse sequence in the direction of the trend followed by a 3-wave corrective sequence. This cycle repeats across higher-order timeframes.
Core Rules of the Impulse Wave
- Wave 2 must not retrace more than 100% of Wave 1.
- Wave 4 must not retrace more than 100% of Wave 3.
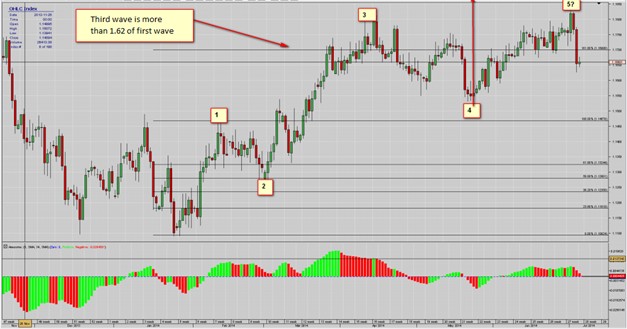
- Wave 3 must always exceed the peak of Wave 1 and is never the shortest wave.
- Wave 4 should not enter the price territory of Wave 1.
2. Tools for Identifying Waves
To aid identification, we use specific technical indicators:
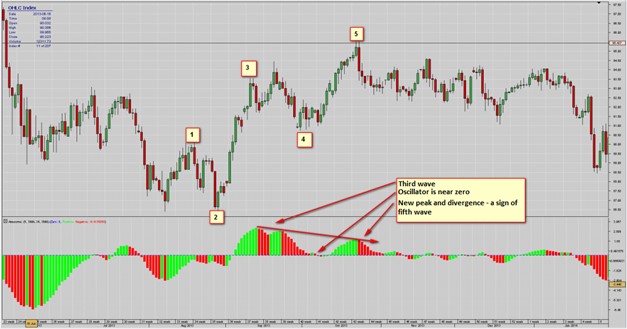
- Awesome Oscillator (AO): Compares short-term (5-period) and long-term (34-period) momentum. The strongest momentum spike typically indicates Wave 3. If the oscillator dips toward zero and creates a divergence, it suggests Wave 5.
- 7-period DMA (Displaced Moving Average): Shifted 5 periods to the right. A break below this often signals Wave 5’s completion.
3. Retracement, Range & Proportions
Statistical tendencies help simplify entry and exit timing:
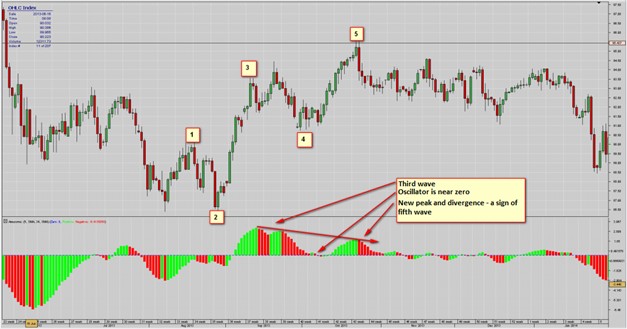
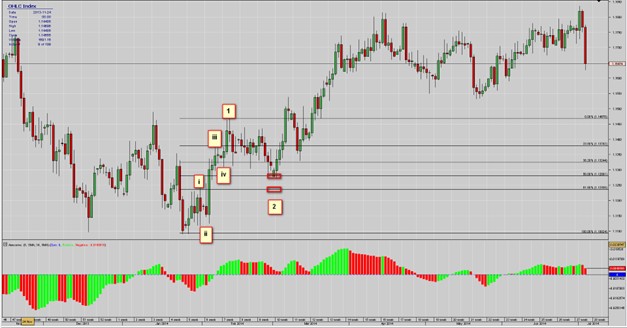
- Wave 2: Usually retraces 50% to 62% of Wave 1.
- Wave 4: Typically retraces 38% to 50% of Wave 3.
Wave Proportions
Wave 3 is often 1.62 or 2.62 times the length of Wave 1. If Wave 3 is extended (>1.62x), Wave 5 is typically equal to Wave 1 or 0.62x Wave 1.
4. Corrective Wave Structures
We focus on two primary types of corrections.
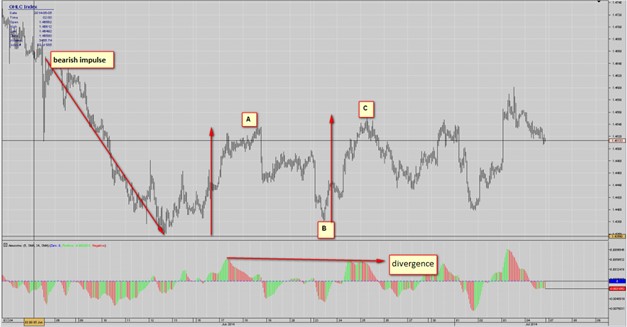
1. Zigzag Correction (5-3-5)
- Wave A: 5 waves opposite the impulse.
- Wave B: 3 waves (~50% of A).
- Wave C: 5 waves opposite the trend.
Divergence on the Awesome Oscillator between Waves A and C often confirms this pattern.
Trade Tip: Trade only when Wave A = Wave C.
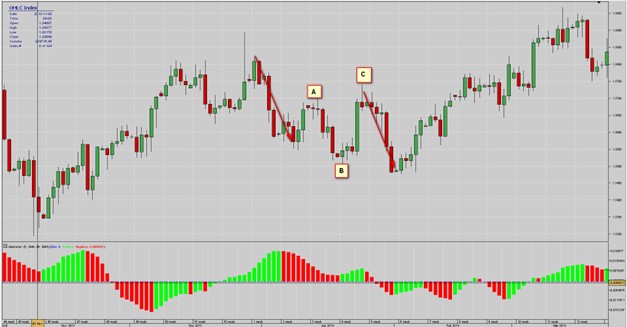
2. Irregular Correction (3-3-5)
In an Irregular Correction (Flat), Wave B exceeds the top of the impulse, and Wave C extends beyond the bottom of Wave A. This is a very common and reliable pattern.
5. The 4-Step Trading Strategy
Here is the profitable framework: look for an Impulse followed by an Irregular or ZigZag correction.
Step I – Identify the Impulse
Look for a clear 5-wave movement. Avoid over-analyzing internal sub-waves; focus on the main direction.
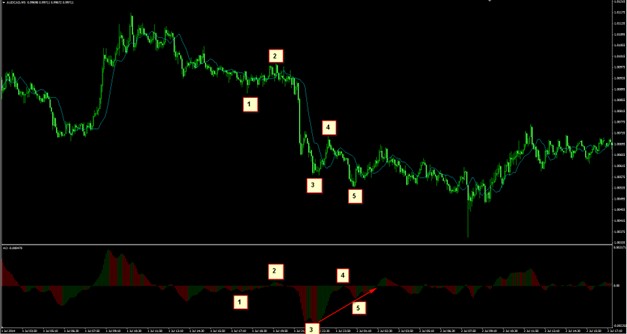
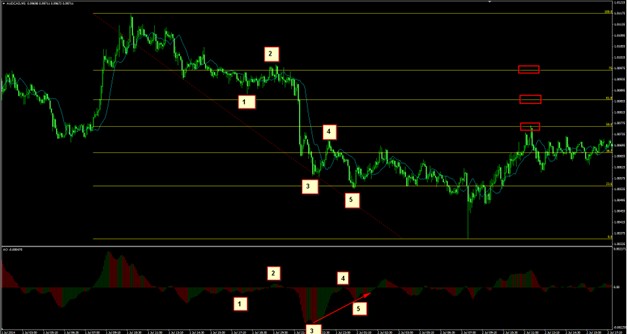
Step II – Confirm End of the Impulse
Check if the impulse is followed by a 3-wave structure. Mark retracement levels for the impulse (50%, 62%, 75%).
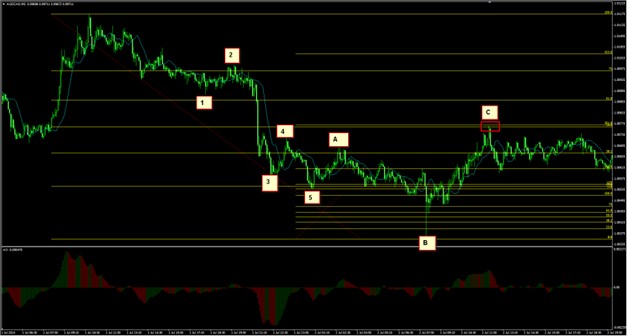
Step III – Define Wave C Range
Identify overlapping zones (confluence). For example, look where the 50% retracement of the impulse overlaps with the 2.62x extension of Wave A.
Step IV – Execute Trade
Use candlestick patterns for entry in the zone. Place your Stop Loss above the critical retracement level (e.g., 75% or 100% of the impulse) and target the next wave extension.
Apply the Theory.
Use advanced charting tools to count waves and spot setups on a risk-free demo account.
Frequently Asked Questions
Is the Irregular Correction common?
Yes, in strong trends, the Irregular (Flat) correction is surprisingly common because market participants are eager to resume the trend, pushing Wave B to a new high/low.
What timeframe is best?
Elliott Wave works best on H1, H4, and Daily charts where noise is reduced compared to lower timeframes.
Why use the Awesome Oscillator?
It provides an objective way to count waves (Wave 3 usually has the highest peak) and spot the divergence typical of Wave 5, removing subjectivity.
⚠️ Disclaimer: The content of this article is strictly for informational purposes and does not constitute investment advice. FXRebate is a cashback and affiliate service, not a broker or fund manager; responsibility for trades and funds lies exclusively with the third-party broker. Trading with leverage involves high risks of capital loss. Partner links used do not generate additional costs for you.