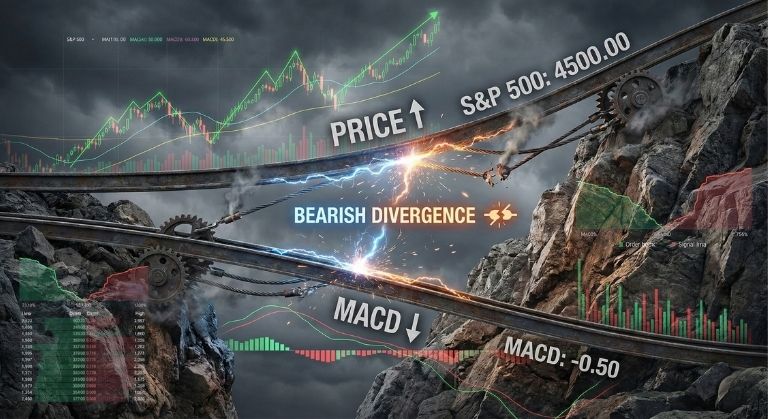
The Discrepancy Between Price and MACD: Trading Divergences
⏱️ Estimated Reading Time: 5 minutes
📝 Summary: This guide explains how to identify potential trend reversals by spotting discrepancies between price action and the MACD indicator, a powerful signal known as divergence.
Charts represent the visual history of price, but sometimes what you see on the price chart doesn’t match what’s happening under the hood. This mismatch is called “Divergence.” Using the MACD (Moving Average Convergence Divergence) indicator, traders can spot these discrepancies early, often signaling that a trend is running out of steam before the reversal actually happens.
Table of Contents
Key Takeaways
- Early Warning: Divergence is a leading indicator, often appearing before price changes direction.
- Bearish Divergence: Price makes Higher Highs, but MACD makes Lower Highs (Sell Signal).
- Bullish Divergence: Price makes Lower Lows, but MACD makes Higher Lows (Buy Signal).
- Patience: Divergence can persist for a long time; wait for a price break to confirm the entry.
1. Understanding the MACD Indicator
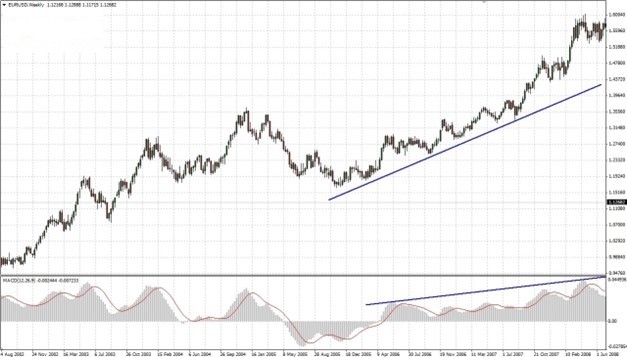
The MACD is a momentum indicator that follows the trend. Ideally, when a trend is strong, the MACD lines or histogram should mirror the price action. If price is making new highs, the MACD should also be making new highs, confirming that buying pressure is increasing.
In the example below, we see a synchronized movement: as EUR/USD rallies, the MACD (blue lines) also rises. This is a healthy trend.
2. What is Divergence?
A discrepancy—or divergence—occurs when the price continues to move in the direction of the trend (e.g., making a new high), but the indicator fails to do so (makes a lower high). This signals that the momentum behind the move is fading.
Think of it as a car going uphill but taking its foot off the gas pedal. The car is still moving up (price is rising), but it is slowing down (MACD is falling) and will soon roll back.
3. Real Chart Examples
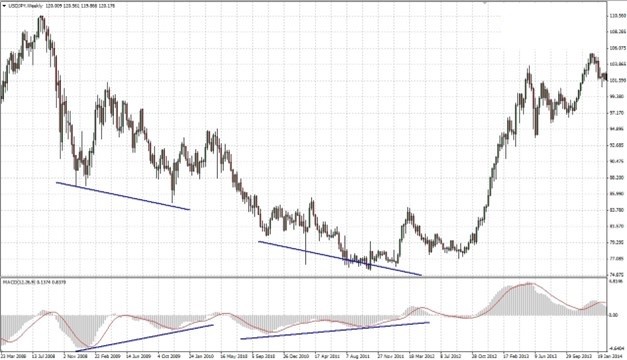
USD/JPY Weekly Divergence:
In the chart below, the price of USD/JPY continued to make lower lows for over three years. However, the MACD histogram started making higher lows (rising blue lines). This Bullish Divergence indicated that selling pressure was exhausting.
Eventually, the downtrend ended, and a massive rally began. The divergence was the first clue that the sellers were losing control.
4. Using Divergence for Confirmation
Warning: Divergence alone is not a sell/buy signal. In strong trends, divergence can persist for weeks while price continues to move against you.
The Strategy: Use divergence as a “setup,” not a trigger. Once you spot the discrepancy:
- Draw a trendline on the price chart.
- Wait for the price to break that trendline.
- Enter the trade only when the break confirms the reversal signaled by the MACD.
Spot the invisible turns.
Use advanced MACD tools on our platform and earn cashback on your trading volume.
Frequently Asked Questions
Is MACD better than RSI for divergence?
Both work well. MACD is often preferred for trend-following divergence because it is unbounded, whereas RSI can get stuck in overbought/oversold zones for long periods.
Does divergence work on all timeframes?
Yes, but higher timeframes (H4, Daily, Weekly) produce much more reliable and profitable signals than shorter timeframes (M5, M15).
What is Hidden Divergence?
Regular divergence signals a reversal. Hidden divergence signals trend continuation (e.g., Price makes a higher low, but MACD makes a lower low—usually a buy signal in an uptrend).
⚠️ Disclaimer: The content of this article is strictly for informational purposes and does not constitute investment advice. FXRebate is a cashback and affiliate service, not a broker or fund manager; responsibility for trades and funds lies exclusively with the third-party broker. Trading with leverage involves high risks of capital loss. Partner links used do not generate additional costs for you.