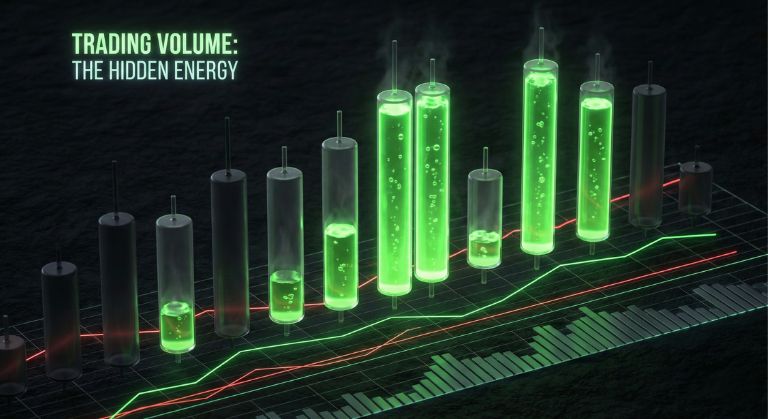
10 Reasons to Monitor Trading Volume
⏱️ Estimated Reading Time: 6 minutes
📝 Summary: This guide explores the critical role of volume analysis in trading, explaining how it confirms trends, identifies reversals, reveals institutional “Smart Money” activity, and helps filter out false breakouts.
Volume represents the total number of shares or contracts exchanged within a specific timeframe. Often overlooked by beginners who focus solely on price, volume acts as the fuel for market movement. It provides a third dimension to the chart, offering clues about the conviction behind price action.
Table of Contents
Key Takeaways
- Truth Detector: Price can lie, but volume reveals the true intent behind the move.
- Smart Money: Sudden volume spikes often indicate institutional entry or exit.
- Validation: A breakout on low volume is likely a trap; high volume confirms the break.
- Exhaustion: High volume after a long trend can signal a climax and potential reversal.
1. Volume Confirms or Contradicts the Price Trend
In a healthy trend, volume should align with the dominant direction. This means:
- Uptrend: Volume should increase on bullish candles and decrease on bearish pullbacks.
- Downtrend: Volume should increase on bearish candles and dry up during upward corrections.
If price is rising but volume is declining, it suggests a lack of buyer interest, warning of a potential reversal.
2. Divergences Between Price and Volume
When volume fails to support price action, a divergence occurs. For example, if the market makes a new high but volume is significantly lower than the previous high, the move is suspect.
While not a standalone entry signal, this divergence acts as a critical “check engine” light, warning traders not to chase the trend.
3. Volume Reveals “Smart Money”
Unlike retail traders, institutional players (banks, hedge funds) trade such large sizes that they cannot hide their footprints. Their activity shows up as sudden, massive volume spikes.
Monitoring these spikes allows you to align your trades with the whales rather than getting crushed by them. If a huge volume spike occurs at a support level without price breaking lower, it’s a classic sign of institutional accumulation.
4. Volume Confirms Breakout Patterns
Technical patterns like Triangles, Flags, or Head & Shoulders rely on breakouts for confirmation. Volume is the judge:
- Valid Breakout: Accompanied by explosive volume, showing conviction.
- False Breakout: Occurs on low or average volume, indicating a lack of follow-through.
Similarly, analyzing volume during low-volatility periods (e.g., holidays) helps filter out noise. Moves during these times often lack institutional backing and are likely to revert.
See what others miss.
Use professional volume indicators on our platform and trade with clarity.
Frequently Asked Questions
Does Forex have real volume?
Forex is decentralized, so there is no central volume data. However, “Tick Volume” (frequency of price changes) is highly correlated with actual volume and is a reliable proxy for retail traders.
What is “Selling Climax”?
It occurs at the end of a downtrend when panic selling leads to extremely high volume. Once the sellers are exhausted, smart money steps in, often reversing the trend.
Can I trade without volume?
Yes, many Price Action traders do. However, ignoring volume means missing out on valuable information about market conviction and institutional participation.
⚠️ Disclaimer: The content of this article is strictly for informational purposes and does not constitute investment advice. FXRebate is a cashback and affiliate service, not a broker or fund manager; responsibility for trades and funds lies exclusively with the third-party broker. Trading with leverage involves high risks of capital loss. Partner links used do not generate additional costs for you.