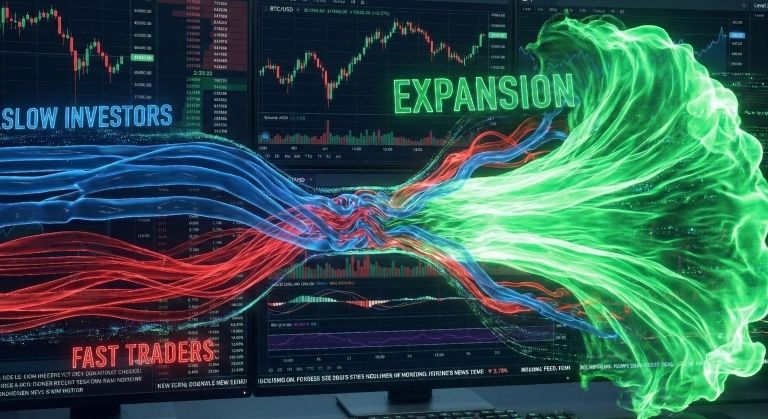
GMMA Strategy Guide: How to Ride Trends Like a Pro
⏱️ Estimated Reading Time: 5 minutes
📝 Summary: The Guppy Multiple Moving Average (GMMA) is a sophisticated trend-following tool. This guide explains how to set up the two groups of moving averages to identify the difference between a simple correction and a true trend reversal.
The GMMA (Guppy Multiple Moving Average) is a powerful technical analysis tool developed by Australian trader Daryl Guppy. While originally designed for equity markets, it has proven to be exceptionally effective in Forex trading as well. Similar to the “Rainbow” strategy, GMMA relies on the interaction between two distinct groups of moving averages to reveal the true market sentiment.
Table of Contents
1. The GMMA Structure
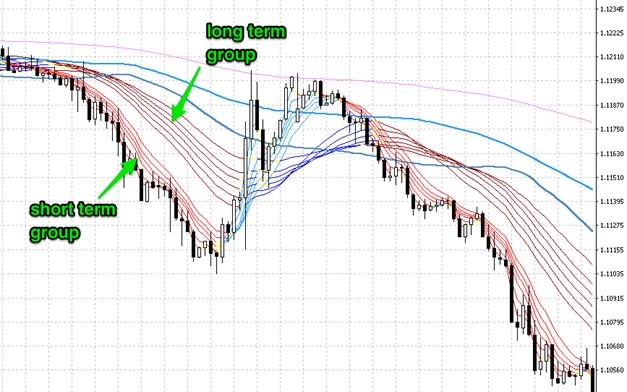
The GMMA indicator is composed of two separate groups of moving averages, each representing a different category of market participants:
- Short-Term Group (Traders): EMA 3, 5, 8, 10, 12, 15. This group reflects the sentiment of speculators and short-term traders.
- Long-Term Group (Investors): EMA 30, 35, 40, 45, 50, 55, 60. This group reflects the sentiment of long-term investors.
2. Visual Interpretation & Colors
In MetaTrader 4, you can use a custom Moving Average indicator to color-code these lines for better visibility. Typically, colors shift to indicate market phases:
- Blue/Light Blue: Often used during corrections.
- Brown/Red: Indicates the resumption of a trend.
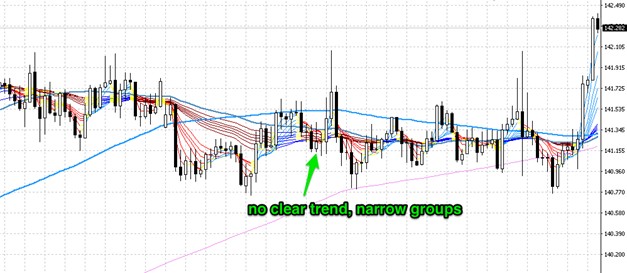
When the two groups compress (move closer together), it signals indecision or a potential breakout. When they expand (move apart), it indicates a strong trend.
3. How to Trade with GMMA
The main purpose of GMMA is to separate a correction from a reversal.
- If the short-term group dips into the long-term group but bounces off, it is a buying opportunity (correction).
- If the short-term group crosses completely below the long-term group, a trend reversal is likely.
To maximize success, never rely on GMMA alone. Combine it with:
1. Higher timeframes.
2. Support and Resistance lines.
3. A 200-period EMA for overall bias.
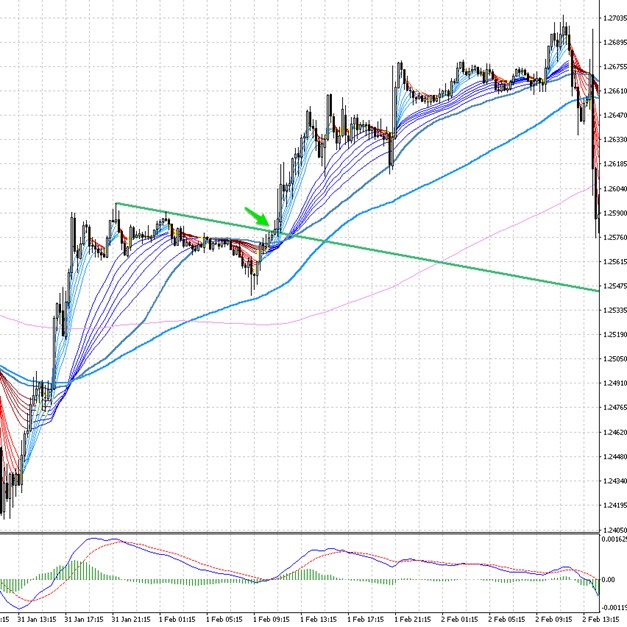
4. Trade Example: GBP/USD (15-Minute)
In this example, we combine GMMA with simple Trendlines. The strategy is to draw a trendline during the consolidation phase and wait for a breakout that aligns with the GMMA direction.
Even though the timeframe is short (M15), aligning the breakout with the dominant GMMA trend ensures higher probability.
5. Trade Example: DAX (30-Minute)
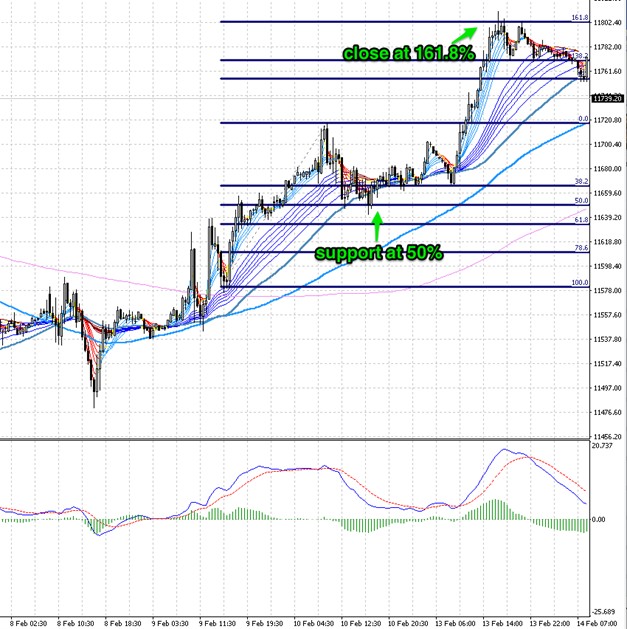
The DAX index often respects technical levels precisely. Here, we combine GMMA with Fibonacci Retracements.
Notice how the price corrected exactly to the 50% Fibonacci level while the GMMA long-term group provided dynamic support. The price then extended all the way to the 161.8% extension, providing a clear exit target.
6. Trade Example: USD/JPY (4-Hour)
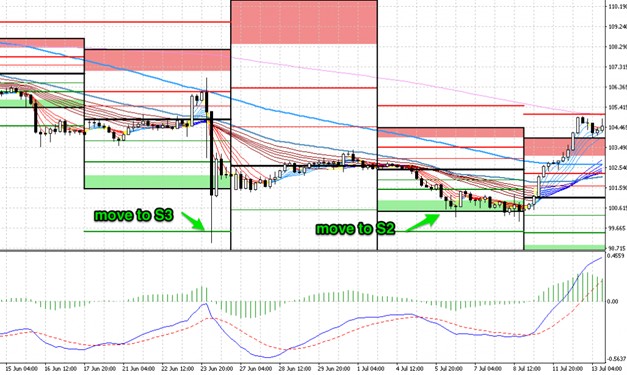
For longer-term trades, the H4 chart offers excellent stability. In this setup, we use:
- GMMA: To identify the trend direction.
- MACD: To confirm momentum.
- Weekly Pivot Points: To set profit targets.
The GMMA kept us in the trade, while the Pivot Points (S2 and S3) helped identify the optimal zones to take profit as the price approached historical support.
Visualize Market Sentiment.
Try the GMMA indicator on a demo account to see the interaction between short-term and long-term traders.
Frequently Asked Questions
What is the best setting for GMMA?
The classic settings are Short-Term (3, 5, 8, 10, 12, 15) and Long-Term (30, 35, 40, 45, 50, 60). These are widely accepted and work well on most timeframes.
Is EMA or LWMA better for GMMA?
It is a matter of preference. EMAs (Exponential) react faster to recent price changes, while LWMAs (Linear Weighted) place even more emphasis on recent data. Both are superior to SMAs for this strategy.
Can GMMA be used on mobile?
Yes, but you have to add each Moving Average line manually (12 lines in total), which can clutter a small screen. It is best used on a desktop platform.
⚠️ Disclaimer: The content of this article is strictly for informational purposes and does not constitute investment advice. FXRebate is a cashback and affiliate service, not a broker or fund manager; responsibility for trades and funds lies exclusively with the third-party broker. Trading with leverage involves high risks of capital loss. Partner links used do not generate additional costs for you.