Fibonacci Trading Instruments: Retracements & Extensions
⏱️ Estimated Reading Time: 5 minutes
📝 Summary: This comprehensive guide covers the full suite of Fibonacci tools (Retracements, Extensions, Arcs, Fans, Time Zones), how to configure them in MT4, and how to apply the ABCD pattern for high-probability trades.
There are many trading tools based on Fibonacci numbers. While the mathematical sequence is ancient, its application in financial markets remains one of the most popular methods for identifying support, resistance, and price targets. Below is a detailed overview of these instruments.
Table of Contents
1. Common Fibonacci Trading Instruments
Fibonacci Retracement
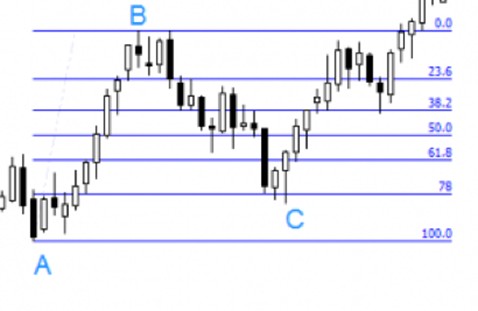
This is the most widely used tool. It helps anticipate where a price correction (pullback) may end within an existing trend, allowing traders to enter at better levels.
Fibonacci Expansions/Extensions
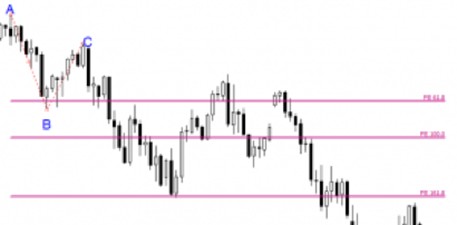
While retracements find entries, extensions project future profit targets. You need three points (High, Low, and End of Correction) to project levels like 61.8%, 100%, and 161.8%.
Fibonacci Time Zones
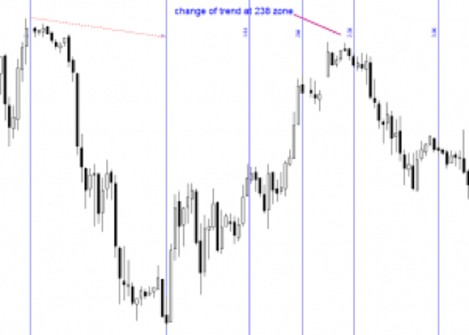
Applied horizontally, these vertical lines mark key moments in time when a trend reversal or significant move is likely to occur.
Fibonacci Arcs
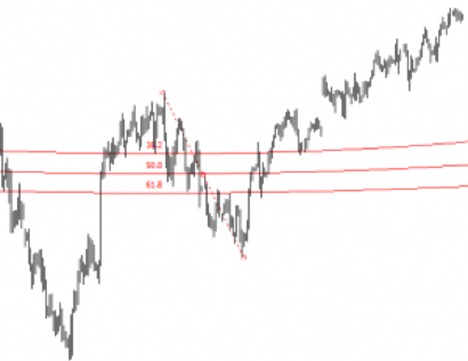
These are curved lines drawn from a high to a low, creating dynamic support and resistance areas at 38.2%, 50%, and 61.8%.
Fibonacci Fan
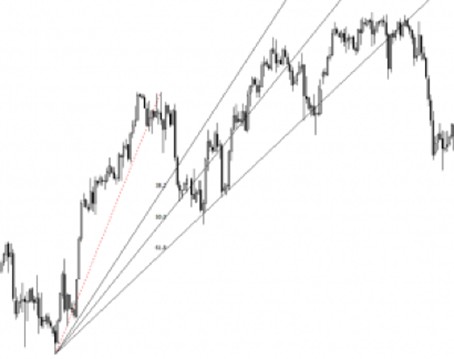
This tool generates diagonal trendlines based on Fibonacci ratios. They act as support or resistance as price moves forward.
2. Setting Up in MetaTrader 4
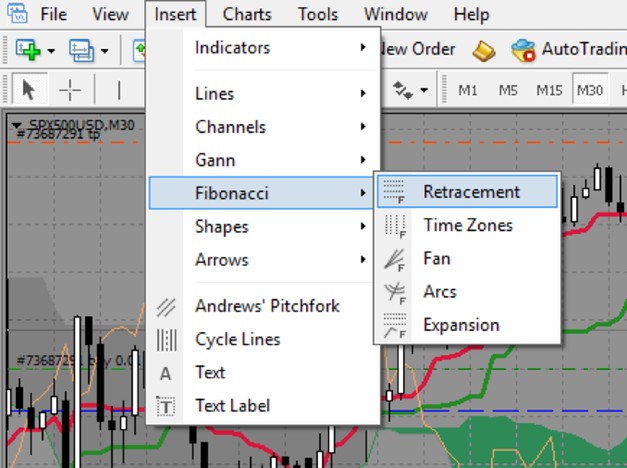
To access these tools, navigate to the top toolbar or use the Insert → Fibonacci menu.
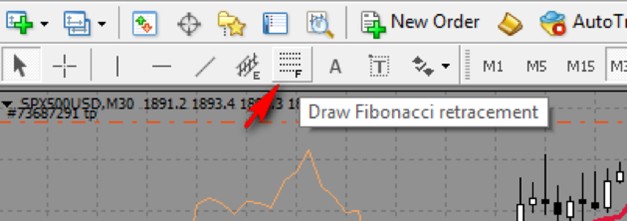
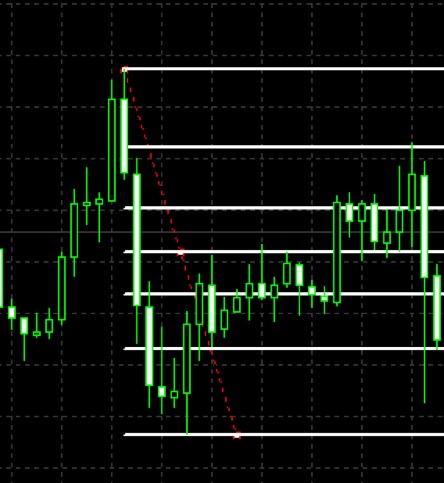
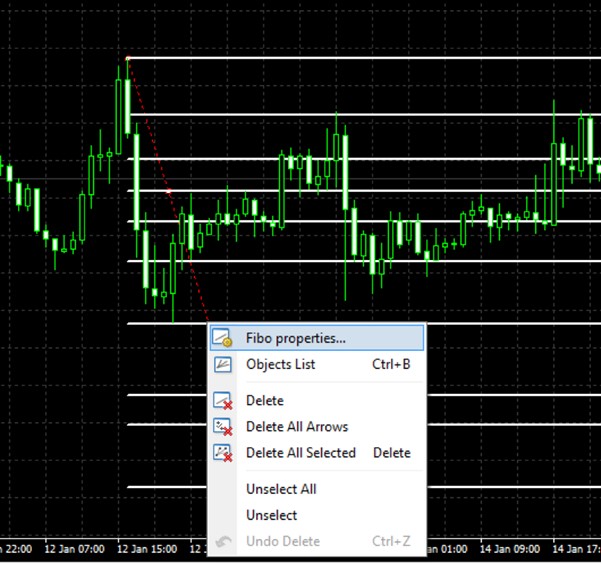
You can customize the levels by double-clicking the line and selecting Fibonacci Properties.
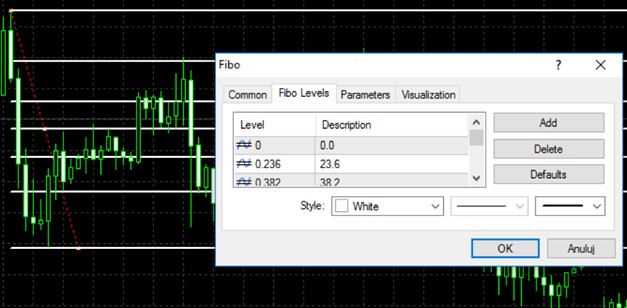
In the Levels tab, you can add custom values like 78.6% or 127.2% to suit your strategy.
3. Recognizing Trends
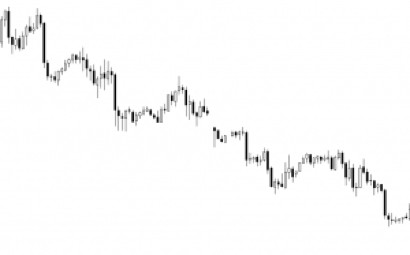
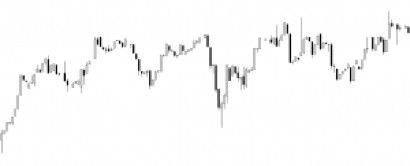
Fibonacci works best in trending markets. You must identify if the market is in an Uptrend, Downtrend, or Range.
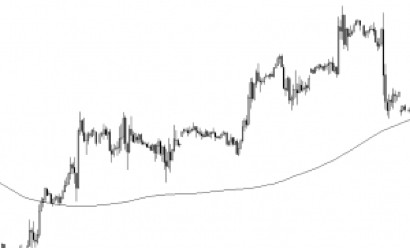
A simple way to filter trends is using the 200 Simple Moving Average (SMA). Price above 200 SMA suggests an uptrend; below suggests a downtrend.
Your trading plan should combine these elements: Trend ID + Fibonacci Level + Entry Signal.
4. The ABCD Pattern
The ABCD pattern is a classic structure where the market moves from A to B, retraces to C, and extends to D.
Key Logic: Enter at C (Retracement) and target D (Extension).
5. Real Trade Examples
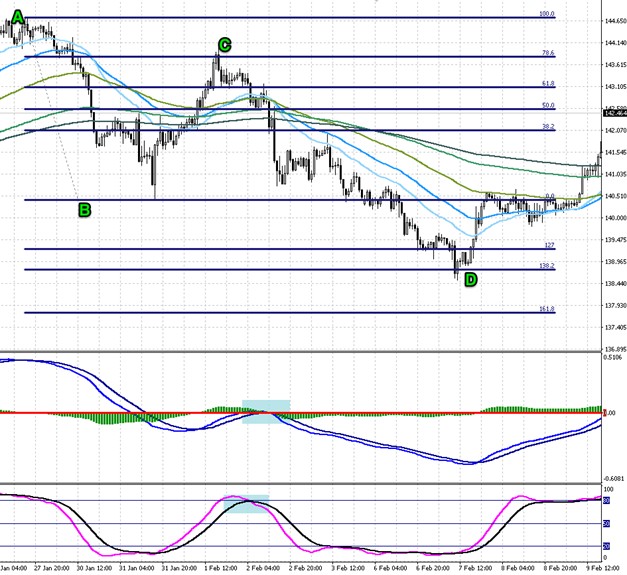
GBP/JPY – 1-Hour Chart
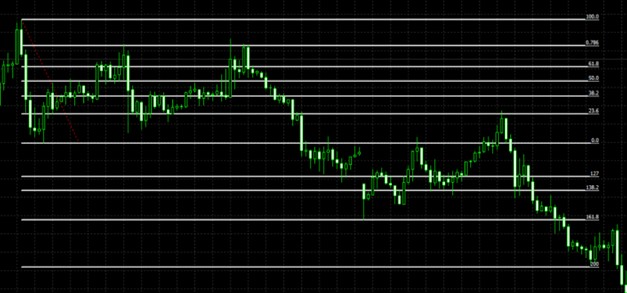
A strong downward move (A-B) was followed by a deep retracement to the 78.6% level. This provided a Sell signal. The price then dropped to the 138.2% extension, completing the trade.
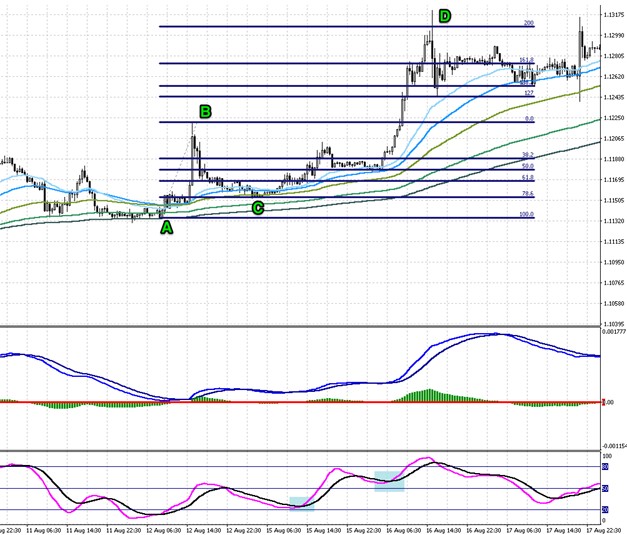
EUR/USD – 30-Minute Chart
In this uptrend, the price retraced to 78.6% (Point C) before rebounding strongly. It hit both the 161.8% and 200% extensions, offering multiple profit targets.
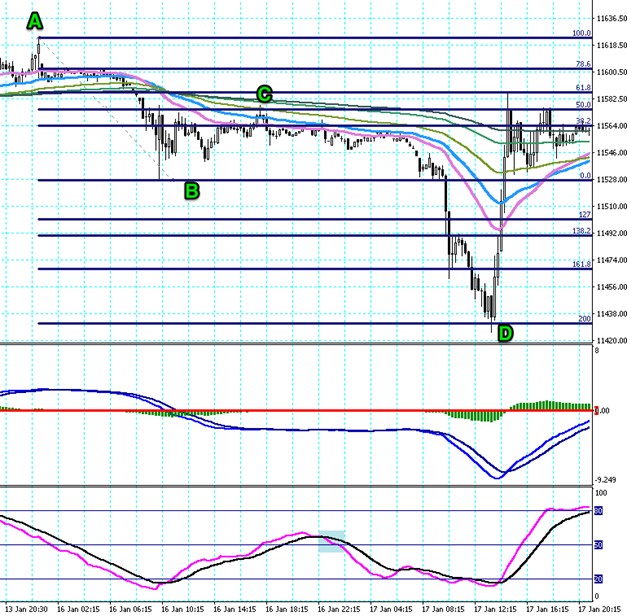
DAX – 15-Minute Chart
Here, the correction stopped precisely at the 50% retracement level. The subsequent move extended all the way to the 200% level, demonstrating the power of these ratios on indices as well.
Master Fibonacci Trading.
Practice drawing retracements and extensions on a risk-free demo account.
Frequently Asked Questions
Which Fibonacci level is the strongest?
The 61.8% level (the Golden Ratio) is considered the strongest. However, 50% and 38.2% are also very common reversal points.
Can I use Fibonacci on any timeframe?
Yes, Fibonacci works on all timeframes from M1 to Monthly. However, levels on higher timeframes (H4, Daily) tend to be more reliable.
How do I know which high and low to pick?
Always choose the most distinct, recent swing high and swing low of the current trend. Practice and experience will help refine your selection.
⚠️ Disclaimer: The content of this article is strictly for informational purposes and does not constitute investment advice. FXRebate is a cashback and affiliate service, not a broker or fund manager; responsibility for trades and funds lies exclusively with the third-party broker. Trading with leverage involves high risks of capital loss. Partner links used do not generate additional costs for you.