
Strategy for Trading in the Flat Market: Bollinger & EMA
This strategy is specifically designed to generate profits when the market moves sideways (consolidation). [cite_start]By combining the volatility channels of Bollinger Bands with the crossover signals of two Exponential Moving Averages (EMA), it identifies precise reversal points within a trading range on the H1 timeframe.
Strategy Profile
Timeframe
H1 (1-Hour)
Condition
Flat / Range
Indicators
3 BBs + 2 EMAs
1. Indicator Setup
[cite_start]
Configure your chart with three sets of Bollinger Bands to create a zone map, and two EMAs for signals:
- Bollinger Bands 1: Period 120, Deviation 1.
- Bollinger Bands 2: Period 120, Deviation 2.
- Bollinger Bands 3: Period 120, Deviation 3.
- Fast EMA: Period 4, Shift 0 (Orange).
- Slow EMA: Period 8, Shift 0 (Red).
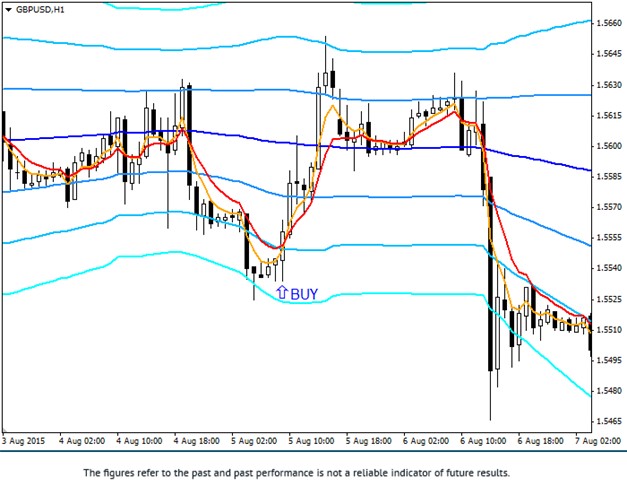
2. Long Entry (Buy) Rules
[cite_start]
Look for a bounce from the lower bands:
- Market Condition: The Bollinger Bands are narrowing (flat market).
- Bounce: Price touches or bounces from one of the bottom bands (Dev 2 or 3).
- Trigger: The Orange EMA (4) crosses the Red EMA (8) from bottom to top.
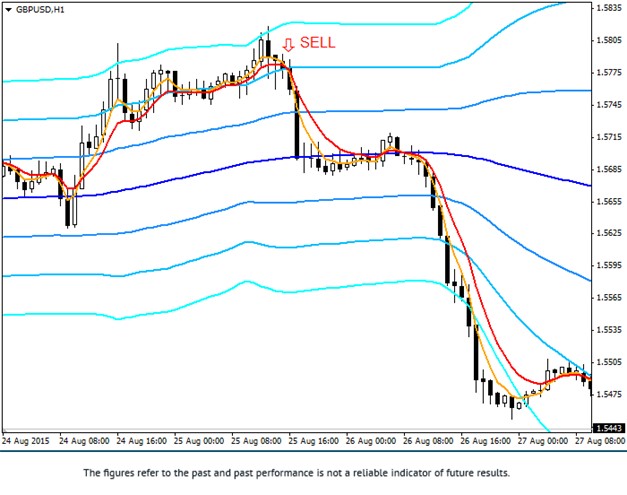
3. Short Entry (Sell) Rules
[cite_start]
Look for a bounce from the upper bands:
- Market Condition: The Bollinger Bands are narrowing.
- Bounce: Price touches or bounces from one of the upper bands (Dev 2 or 3).
- Trigger: The Orange EMA (4) crosses the Red EMA (8) from top to bottom.
Trade Management
- Stop Loss: 15 points from the entry.
- Take Profit: 15-20 points, or exit when price touches the Middle Band.
Master the Range: Turn sideways markets into profit opportunities with FXRebate.