
Support & Resistance Strategy: The 240-Bar System
This strategy offers a structured approach to trading Support and Resistance levels on the H4 timeframe. Instead of drawing subjective lines, it relies on a calculation based on the past 240 bars (representing roughly 6 weeks of price action on H4) to identify critical reversal zones.
Strategy Profile
Timeframe
H4 (Recommended)
Pairs
EURUSD, GBPUSD
Risk:Reward
1:4
1. Indicator Setup
This strategy requires a custom or standard Support/Resistance indicator capable of looking back a specific number of periods:
- Lookback Period: Set the calculation parameter to 240 bars. (Or manually identify highs/lows over the last 240 candles).
- Significance: Keep in mind that the number of bars should not be less than 200 to effectively filter out market noise.
2. Short Entry (Sell) Rules
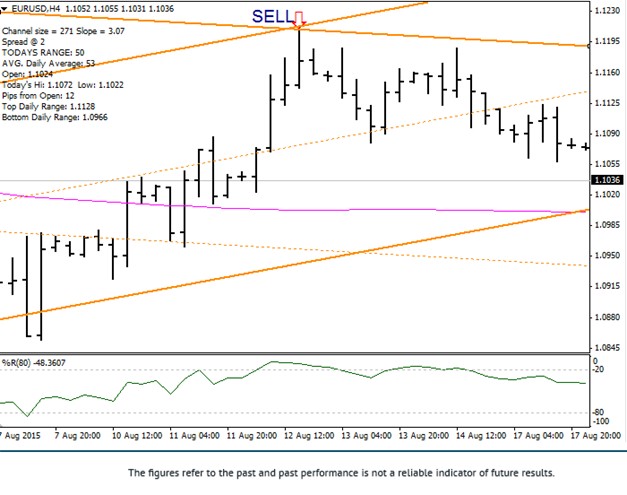
Execute a sell trade when price interacts with a major structural high:
- Identify Resistance: Wait for the indicator to draw the upper resistance line (Orange/Yellow line).
- Trigger: Open a Sell position when the price touches or rejects this resistance level.
3. Long Entry (Buy) Rules
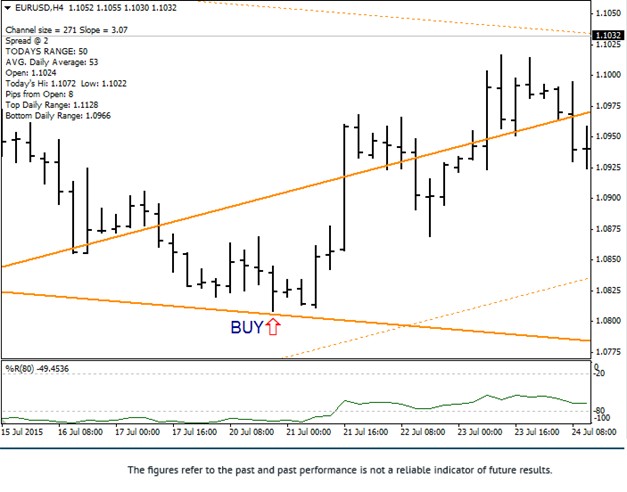
Execute a buy trade when price interacts with a major structural low:
- Identify Support: Wait for the indicator to draw the lower support line.
- Trigger: Open a Buy position when the price touches or rejects this support level.
Risk Management
This strategy aims for a high 1:4 Risk-to-Reward Ratio.
- Stop Loss: 20 points (pips) from the entry.
- Take Profit: 80 points (pips).
Trade Key Levels with Confidence: Get cashback on every trade, win or lose.