Momentum Trading – A Guide to Trading Based on Price Action
⏱️ Estimated Reading Time: 6 minutes
📝 Summary: This guide explains the concept of Momentum (trend intensity) in price action. It covers how to identify strong candles, spot reversals using the 20 SMA, trade breakouts, and recognize when momentum is fading.
Momentum is one of the most critical concepts when it comes to interpreting price charts and making good trading decisions. [cite_start]In this article, I will explain how I use momentum in my strategy and how to understand this term when analyzing price action charts[cite: 1, 2, 3].
Table of Contents
Key Takeaways
- Definition: Momentum equals the intensity of the trend and is visible in strong candle bodies.
- Reversals: A sudden sequence of strong bearish candles after a rally often signals a momentum shift.
- Breakouts: High momentum is required to validate a breakout from support/resistance levels.
- Fading: Shrinking candles during a trend indicate exhaustion and potential reversal.
1. What is Momentum?
First, let’s understand the real meaning of the concept:
- Momentum = intensity of the trend
- Momentum = Strong candles
There are two perspectives. The first deals only with the overall intensity of the trend. If we analyze the situation on a micro level, we will notice that momentum also exists within individual candles. [cite_start]A large candle without shadows is considered to have strong momentum, while a candle with a small body but large wicks does not exhibit momentum [cite: 5-11].
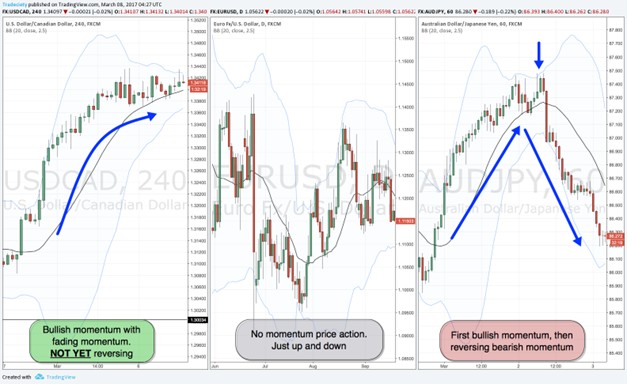
Below are three examples:
- A trend with strong bullish momentum at the beginning, but which fades over time (Left).
- A price chart lacking momentum, where the price oscillates without a clear direction (Center).
- A market where the price transitioned from strong bullish momentum to strong bearish momentum (Right)[cite: 12].
[cite_start]
[cite_start]
2. Tracking and Understanding Momentum
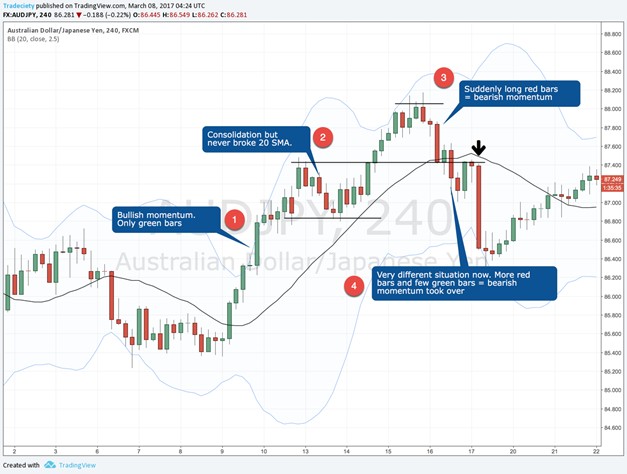
To understand and interpret charts like a professional, you need to observe momentum during trends and reversals. Initially, we might see a strong upward trend with the price approaching the outer edges of the Bollinger Bands. [cite_start]Then, the price enters a period of consolidation—a normal behavior [cite: 15-17].
However, at the peak, if the price reverses strongly, marked by a sequence of three bearish candles, this should grab your attention. [cite_start]This intense bearish momentum marks a significant change in dynamics [cite: 19-21].
[cite_start]
3. Analyzing Candles & Micro-Momentum
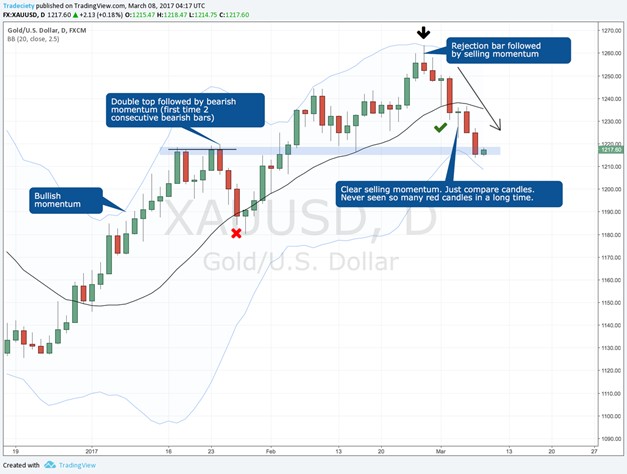
Let’s analyze another chart with a focus on price action. Initially, the price experiences a strong rally. Later, the first consolidation occurs. [cite_start]Eventually, the price continues its rally but does not develop more consecutive bearish candles until it spikes through the Bollinger Bands [cite: 24-27].
At this point, multiple bearish candles appear, and bulls fail to counter. The price breaks the 20 SMA with a high-momentum candle and continues downward. [cite_start]The momentum reversal is evident, marked by a pattern consisting of two bearish candles and a pinbar signaling this event [cite: 28-30].
[cite_start]
4. Using Momentum in Breakouts
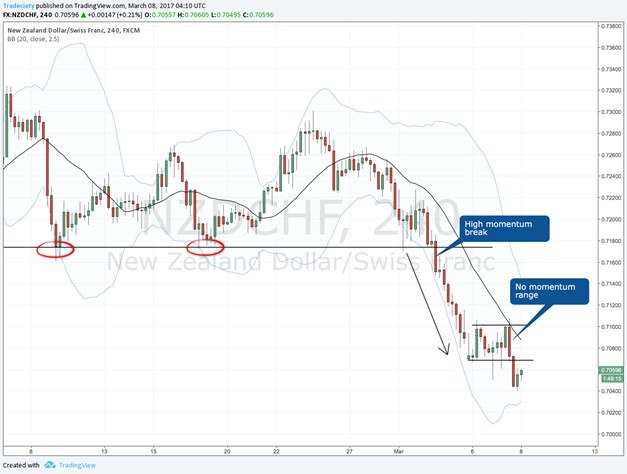
Besides trading trends or reversals, this concept is helpful in identifying high-probability breakout points. [cite_start]I prefer drawing support and resistance levels in strong impact zones and then waiting for a strong breakout with high momentum [cite: 33-35].
The screenshot below captures a trade where NZD/JPY (CHF in chart) was in a wide range. [cite_start]The price rejected the level multiple times, but when a breakout with high momentum occurred, the situation changed [cite: 36-37].
[cite_start]
5. Momentum Fading – USD/CAD Example
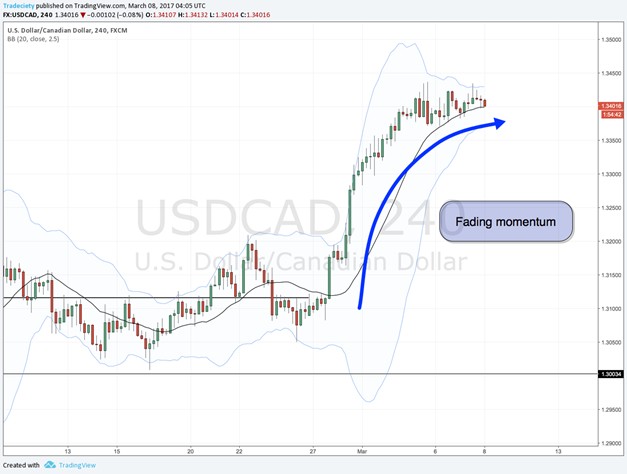
The chart of USD/CAD on the 4-hour time frame shows an upward trend where momentum gradually loses strength. [cite_start]This can indicate a loss of trend intensity followed by sideways movement or a reversal [cite: 39-42].
Most traders make the mistake of not waiting for the final momentum signal. If I intend to sell USD/CAD, I will wait for the appearance of a clear bearish candle with high momentum. [cite_start]Amateurs will try to predict a move, which is a low-probability trade [cite: 45-48].
[cite_start]
Conclusion
Momentum analysis is not a complicated theory, but it is an efficient method for interpreting charts. [cite_start]While it may not be sufficient to determine entry points on its own, when combined with other tools, it becomes a very powerful Forex price action strategy [cite: 31-32, 50].
Practice Momentum Trading Risk-Free.
Open a demo account with a top-tier broker and learn to spot these patterns without risking capital.
Frequently Asked Questions
What indicates strong momentum?
[cite_start]
Large candles with very small or no shadows (wicks) indicate strong momentum and conviction in the market direction[cite: 11].
Can momentum predict reversals?
Yes. [cite_start]A loss of momentum (fading) or a sudden appearance of strong opposing candles (like in the AUDJPY example) often signals an impending reversal[cite: 19].
Is momentum enough to trade?
Not usually. [cite_start]While powerful, momentum analysis works best when combined with other tools like Support/Resistance or Trendlines to determine precise entry points[cite: 32].
⚠️ Disclaimer: The content of this article is strictly for informational purposes and does not constitute investment advice. FXRebate is a cashback and affiliate service, not a broker or fund manager; responsibility for trades and funds lies exclusively with the third-party broker. Trading with leverage involves high risks of capital loss. Partner links used do not generate additional costs for you.