Ichimoku Kinko Hyo: The “One Glance” Strategy
⏱️ Estimated Reading Time: 7 minutes
📝 Summary: This comprehensive guide breaks down the Ichimoku Kinko Hyo system, explaining its five key components (Tenkan, Kijun, Chikou, Senkou A & B) and detailing specific strategies for trend-following and cloud breakouts.
The Ichimoku Kinko Hyo trading system, developed by Japanese journalist Goichi Hosoda before World War II, is a comprehensive trend-following indicator. Hosoda, writing under the pseudonym “Ichimoku Sanjin,” spent over 30 years refining the strategy before publishing it in 1969. The name roughly translates to “Equilibrium chart at a glance,” reflecting its ability to provide a complete market overview in seconds.
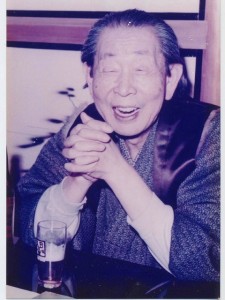
Table of Contents
Key Takeaways
- Holistic View: Ichimoku shows trend direction, support/resistance, and momentum in one chart.
- The Cloud: The “Kumo” is the core; trade with the trend relative to the Cloud (Buy above, Sell below).
- Lagging Span: The Chikou Span confirms the trend by comparing current price to past price.
- Timeframes: Works best on H4 and Daily charts; originally optimized for JPY pairs.
1. Key Components of the Ichimoku System
Unlike standard moving averages that use closing prices, Ichimoku lines are calculated based on the average of the High and Low over specific periods. This provides a better representation of price equilibrium.
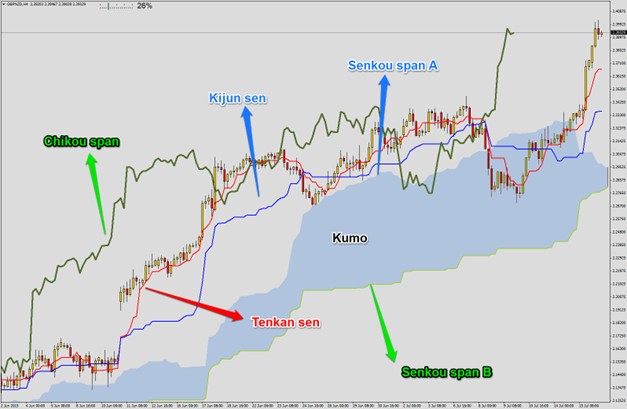
- Tenkan-Sen (Conversion Line): (Highest High + Lowest Low) / 2 for the last 9 periods. Used for short-term momentum.
- Kijun-Sen (Base Line): (Highest High + Lowest Low) / 2 for the last 26 periods. Indicates medium-term momentum and key support.
- Chikou Span (Lagging Span): Current closing price plotted 26 periods back. Confirms trend strength.
- Senkou Span A: Average of Tenkan and Kijun, plotted 26 periods ahead. Forms one edge of the Cloud.
- Senkou Span B: (Highest High + Lowest Low) / 2 for the last 52 periods, plotted 26 periods ahead. Forms the other edge of the Cloud.
2. How to Interpret the Cloud (Kumo)
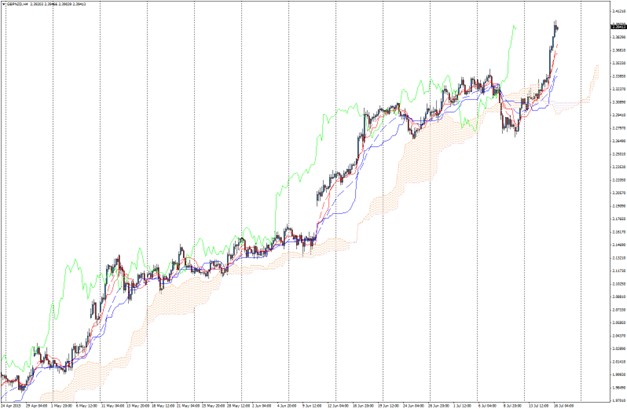
The space between Senkou Span A and Senkou Span B is called the Kumo (Cloud). It is the most distinctive feature of the system.
- Trend Filter: If price is above the Cloud, the trend is Bullish. If below, the trend is Bearish. If inside, the market is ranging/neutral.
- Support/Resistance: A thick Cloud offers strong support/resistance, while a thin Cloud is easily broken.
- Sentiment: If Span A is above Span B, the Cloud is usually colored green (Bullish). If Span A is below Span B, it is red (Bearish).
3. Trading Signals: Crossovers & Breakouts
Ichimoku generates several types of signals, varying in strength depending on their position relative to the Cloud.
The TK Crossover (Tenkan/Kijun)
Similar to a MACD crossover, this signal occurs when the fast line (Tenkan) crosses the slow line (Kijun).
| Signal Type | Condition | Strength |
|---|---|---|
| Bullish | Tenkan crosses above Kijun Above Cloud | Strong |
| Bullish | Tenkan crosses above Kijun Inside Cloud | Neutral |
| Bearish | Tenkan crosses below Kijun Below Cloud | Strong |
Kumo Breakouts
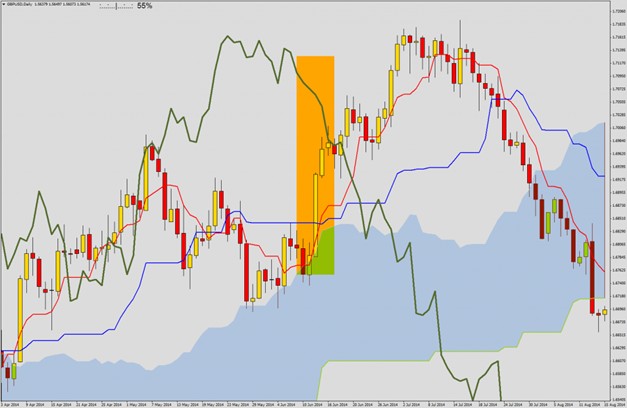
This is a pure trend-following signal. A candle closing above the Cloud signals a potential new uptrend (Buy). A close below signals a downtrend (Sell). The more dynamic the breakout candle, the stronger the signal.
4. Optimizing Your Strategy
To reduce false signals and improve win rates:
- Multi-Timeframe Analysis: Always confirm the trend on a timeframe 4x higher. If trading M15, check the H1 Cloud.
- Wait for Chikou: Ensure the Chikou Span is also free of obstacles (price candles) before entering.
- Risk Management: Use a minimum Risk/Reward ratio of 1:3. Place stop losses on the opposite side of the Kijun-Sen or the Cloud.
Ready to trade with clarity?
Apply the Ichimoku strategy on a professional platform and earn cashback on every trade.
Frequently Asked Questions
Is Ichimoku good for beginners?
It can be visually overwhelming at first, but once the components are understood, it is an excellent system for beginners because it enforces trend discipline and filters out noise.
What is the best timeframe for Ichimoku?
Hosoda designed it for the Daily chart. However, it works well on H4 and H1. It is less reliable on very short timeframes (M1, M5) due to market noise.
Can I use Ichimoku with other indicators?
Ichimoku is a standalone system, but many traders add Price Action (candlestick patterns) or RSI to identify divergences for better entry timing.
⚠️ Disclaimer: The content of this article is strictly for informational purposes and does not constitute investment advice. FXRebate is a cashback and affiliate service, not a broker or fund manager; responsibility for trades and funds lies exclusively with the third-party broker. Trading with leverage involves high risks of capital loss. Partner links used do not generate additional costs for you.