
How to Draw Support and Resistance Levels: Zones vs. Lines
⏱️ Estimated Reading Time: 6 minutes
📝 Summary: This guide challenges the traditional method of drawing single lines for support and resistance, advocating instead for “zones” to better capture market volatility and filter out false breakouts.
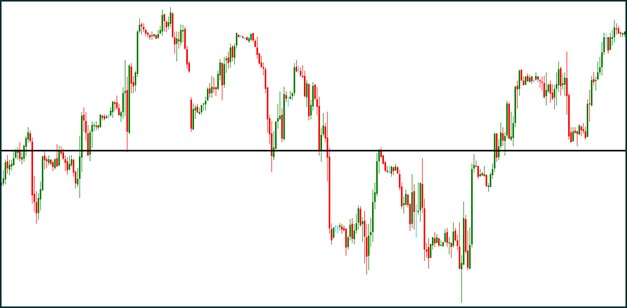
Trading based on support and resistance may appear straightforward: simply draw a horizontal line at a level where the price has previously reversed and wait for the market to return to that zone. In reality, however, most traders struggle to apply this technique effectively because markets rarely respect precise single price points.
Table of Contents
Key Takeaways
- Zones, Not Lines: Markets are dynamic; prices reverse in areas, not at exact digits.
- Volatility Buffer: Zones absorb wicks and spikes that would otherwise trigger stop losses.
- Noise Filter: Support zones help you ignore minor fluctuations on lower timeframes.
- Reliability: A zone strategy reduces the number of false signals and missed entries.
1. The Trap of Thin Lines
When traders refer to support and resistance, they often visualize a clean, single line on a chart. At first glance, the idea of profiting from these lines seems intuitive. But upon closer examination, the shortcomings of this simplistic strategy become apparent.
2. The Truth About Market Precision
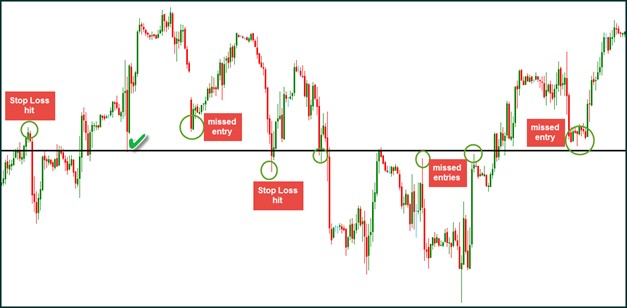
Traders who rely solely on thin horizontal lines typically encounter one of two frustrating problems:
- The Missed Trade: The price reverses just before reaching the line, causing missed opportunities.
- The False Breakout: The price slightly breaches the level (a “wick” or “spike”), triggers stop losses, and then reverses as originally planned.
These recurring patterns cause frustration and lead to over-aggressive trading or consistent losses due to tight stop placement.
3. The Professional Approach: Support and Resistance Zones
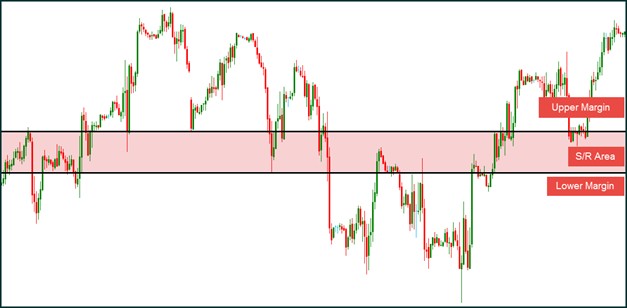
Experienced traders understand that market prices rarely respect precise levels. Instead, zones of support and resistance provide a more realistic depiction of where reversals can occur.
How to draw effective zones:
- Use broader rectangles instead of single lines.
- Capture the “extremes” (wicks) and the “closes” (bodies) of candles within the zone.
- Allow for volatility buffers.
These zones don’t guarantee success, but they allow for better price action interpretation than rigid lines.
4. Filtering Market “Noise” with Zones
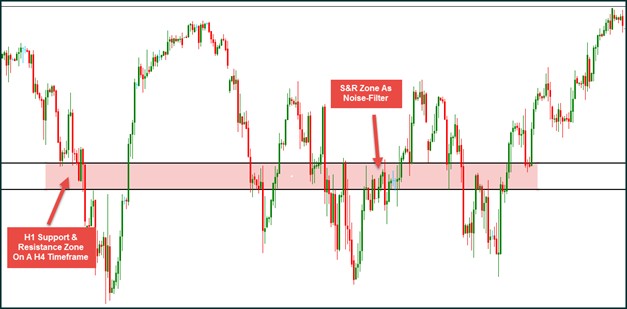
Support and resistance zones also act as filters for market noise, especially on higher timeframes like H4. They reduce impulsive trading behavior by providing structured reference areas where price movements can be analyzed more clearly.
Instead of reacting to every price wiggle, zones help traders stay focused on meaningful levels, avoiding erratic decision-making caused by short-term volatility.
5. Why Many Traders Fail With This Technique
Here are three common reasons traders do not profit using support and resistance:
- Drawing overly thin lines that ignore price volatility.
- Missing trades when price reverses prematurely.
- Being stopped out when price overshoots the level briefly (Stop Hunting).
By drawing zones instead of lines, traders obtain a clearer view of potential reversals and reduce sensitivity to short-term fluctuations.
Improve your chart analysis.
Open an account and apply professional charting techniques on advanced platforms.
Frequently Asked Questions
How wide should a support zone be?
It depends on the timeframe and volatility. A zone on a Daily chart might cover 50 pips, while on a 15-minute chart it might be 10 pips. It should cover the recent wicks and bodies.
Does a break of a zone mean the trend has changed?
Not necessarily. Wait for a “retest” of the zone. If the price breaks through and then uses the zone as new support/resistance, the break is confirmed.
Should I use shadows or bodies for zones?
Use both. The zone should encompass the area between the candle bodies (closes) and the tips of the shadows (wicks) to capture the full range of market reaction.
⚠️ Disclaimer: The content of this article is strictly for informational purposes and does not constitute investment advice. FXRebate is a cashback and affiliate service, not a broker or fund manager; responsibility for trades and funds lies exclusively with the third-party broker. Trading with leverage involves high risks of capital loss. Partner links used do not generate additional costs for you.