
Moving Average Lines & Parabolic SAR: Trend Confirmation
This strategy is designed to catch trends on the H1 timeframe by combining the crossover of three Exponential Moving Averages (EMA) with the trend-following capability of the Parabolic SAR. It provides clear entry signals and a dynamic exit method.
Strategy Profile
Timeframe
H1, M30
Pairs
All Pairs
Indicators
3 EMAs + PSAR
1. Indicator Setup
Configure your chart with the following settings:
- Parabolic SAR: 0.2, 0.02.
- EMA 10: Gold line (Fast).
- EMA 25: Green line (Medium).
- EMA 50: Red line (Slow).
2. Long Entry (Buy) Rules
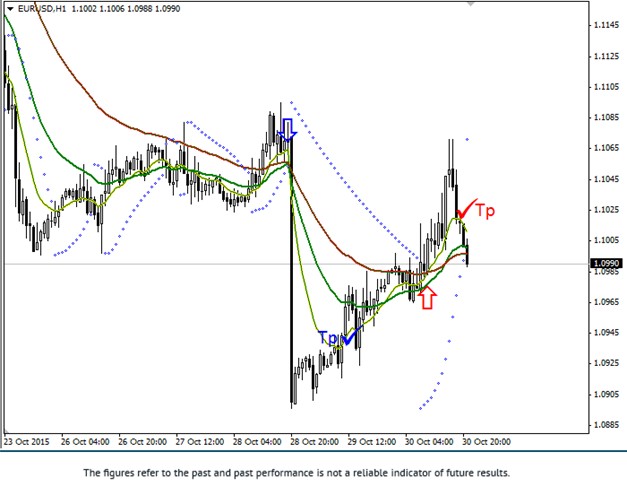
- Crossover: The Gold EMA 10 crosses both EMA 25 and EMA 50 from bottom to top.
- Trend: The Parabolic SAR dot is below the price.
3. Short Entry (Sell) Rules
- Crossover: The Gold EMA 10 crosses both EMA 25 and EMA 50 from top to bottom.
- Trend: The Parabolic SAR dot is above the price.
Exit Strategy
- Stop Loss: Slightly beyond the EMA 50 (Red line).
- Take Profit: Close when the price crosses all 3 EMAs in the opposite direction.
Identify Strong Trends: Use this H1 system for consistent entries and earn rewards with FXRebate.