
Three Indicators Strategy: AO, AC, and Parabolic SAR
This strategy combines three powerful tools to forecast trend changes and capture market momentum. Using Bill Williams’ Accelerator Oscillator (AC) and Awesome Oscillator (AO) alongside the Parabolic SAR, it provides a confirmed signal for entering trends at their inception on the H1 timeframe.
Strategy Profile
Timeframe
H1
Pairs
Major Pairs
Indicators
AO + AC + SAR
1. Indicator Setup
Apply the following standard indicators to your H1 chart:
- Parabolic SAR (PSAR): Default settings.
- Awesome Oscillator (AO): Default settings.
- Accelerator Oscillator (AC): Default settings.
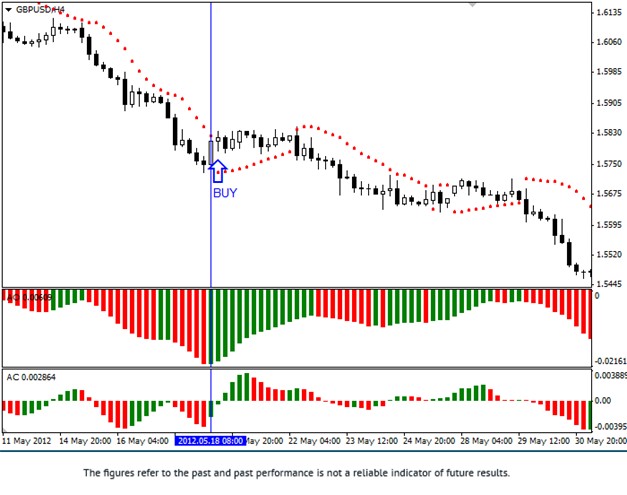
2. Long Entry (Buy) Rules
All three conditions must be met on the same “signal” candle:
- Trend: Parabolic SAR dots are below the price chart.
- Momentum: AO Histogram changes color from Red to Green.
- Acceleration: AC Histogram changes color from Red to Green.
Action: Open Buy at the opening of the next candle.
3. Short Entry (Sell) Rules
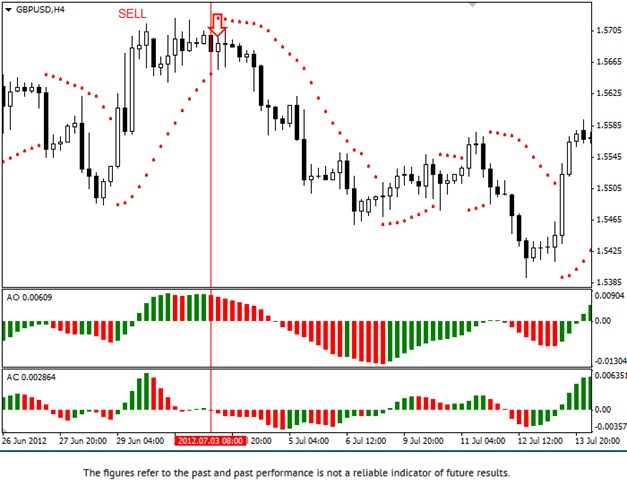
All three conditions must be met on the same “signal” candle:
- Trend: Parabolic SAR dots are above the price chart.
- Momentum: AO Histogram changes color from Green to Red.
- Acceleration: AC Histogram changes color from Green to Red.
Action: Open Sell at the opening of the next candle.
Trade Management
- Stop Loss: Place at the High/Low of the signal candle.
- Take Profit: 1:1 ratio (equal distance to Stop Loss).
- Alternative Exit: Close when both AO and AC change color against your trade.
Combine and Conquer: Use this triple-indicator system and earn rebates on every trade.