SMA 150 + Stochastic + RSI: The Deep Correction Strategy
This strategy is designed to identify high-probability entry points by catching “deep corrections” within an established trend. It combines a long-term Moving Average for trend direction with the Stochastic Oscillator and RSI to pinpoint the exact end of a retracement.
Strategy Profile
Trend Filter
SMA 150
Triggers
Stoch + RSI
Type
Pullback
1. Indicator Setup
Configure your chart with the following settings:
- Simple Moving Average (SMA): Period 150 (Trend Baseline).
- Stochastic Oscillator: Standard settings (e.g., 5, 3, 3) with levels at 20 and 80.
- RSI (Relative Strength Index): Period 3 (Short term) or 14, depending on sensitivity preference.
2. Trading Rules
Long Entry (Buy)
- Trend: Price must be trading above the SMA 150.
- Correction: Wait for the Stochastic to drop below 20 (Oversold condition).
- Trigger: Enter when the Stochastic lines cross upward AND the RSI confirms momentum (turns up).
Short Entry (Sell)
- Trend: Price must be trading below the SMA 150.
- Correction: Wait for the Stochastic to rise above 80 (Overbought condition).
- Trigger: Enter when the Stochastic lines cross downward AND the RSI confirms momentum (turns down).
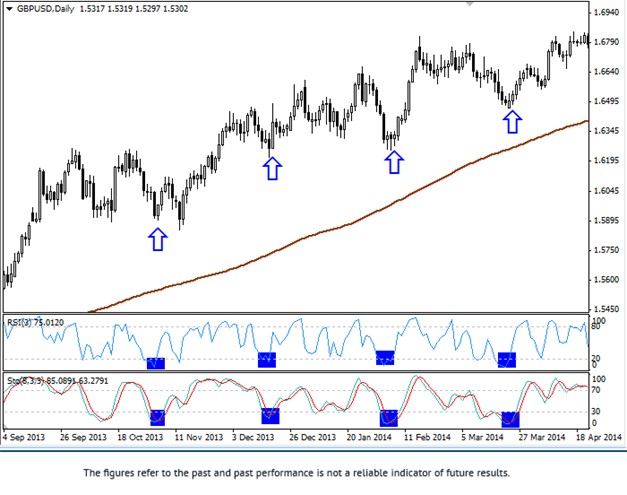
Trade the Pullback: Use the Deep Correction strategy to enter trends at the best price and earn rebates.