
Bollinger Bands & RSI: A Momentum Breakout Strategy
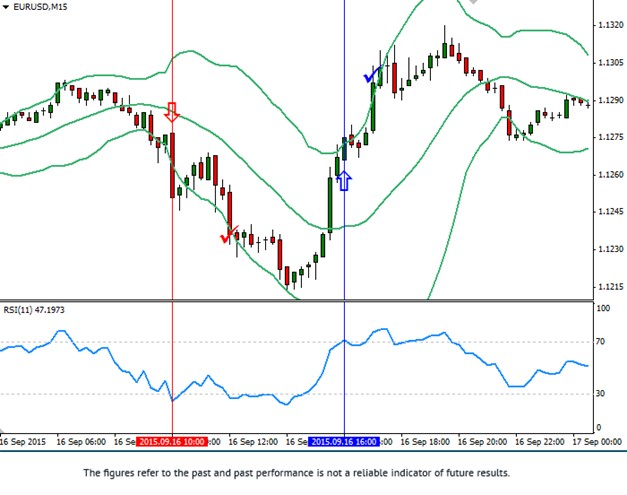
The “Bollinger Bands and RSI” strategy is a high-momentum breakout system designed for M15 and M30 timeframes. Unlike reversion strategies that fade the bands, this system aggressively enters the market when price breaks the outer bands with strong RSI confirmation, signalling a volatility expansion.
Strategy Profile
Timeframe
M15, M30
Pairs
All Pairs
Concept
Momentum Breakout
1. Indicator Setup
- Bollinger Bands: Period 20, Deviation 2 (Standard).
- Relative Strength Index (RSI): Period 11 (Faster than standard).
2. Entry Rules
Long Entry (Buy)
Open a buy trade when the market shows extreme bullish strength:
- Price: Must close ABOVE the Upper Bollinger Band.
- Momentum: The RSI (11) must be above 70.
Short Entry (Sell)
Open a sell trade when the market shows extreme bearish strength:
- Price: Must close BELOW the Lower Bollinger Band.
- Momentum: The RSI (11) must be below 30.
Exit Strategy (Scalping)
Stop Loss
10 points (pips) above or below the entry point.
Take Profit
M15: 15 pts (EURUSD), 19 pts (GBPUSD).
M30: 19 pts (EURUSD), 25 pts (GBPUSD).
Trade Smarter with FXRebate: Get cashback on every trade you execute.