
Trend Following with Three Simple Moving Averages
This is a classic trend-following strategy that utilizes the hierarchy of three Simple Moving Averages (SMA) to filter noise and identify strong directional momentum. By stacking long-term, medium-term, and short-term trends, traders can enter high-probability setups with a clear directional bias.
Strategy Profile
Timeframes
H1, H4, D1
Pairs
All Major Pairs
Indicators
3 SMAs (50, 20, 5)
1. Indicator Setup
Apply the following Simple Moving Averages to your chart to establish the trend hierarchy:
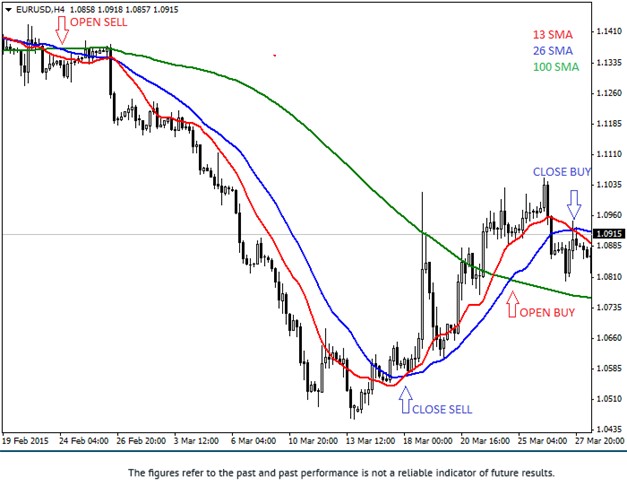
- Long-term Trend: SMA 50 (Green).
- Medium-term Trend: SMA 26 (Blue).
- Signal Line: SMA 13 (Red).
2. Entry Rules
Long Entry (Buy)
Look for a perfect bullish alignment:
- Trend: The 26 SMA crosses the 100 SMA from bottom to top.
- Trigger: The 13 SMA crosses both the 26 and 100 SMAs from bottom to top.
Short Entry (Sell)
Look for a perfect bearish alignment:
- Trend: The 26 SMA crosses the 100 SMA from top to bottom.
- Trigger: The 13 SMA crosses both the 26 and 100 SMAs from top to bottom.
Exit Strategy
Close the trade immediately when the 13 SMA crosses back over the 26 SMA in the opposite direction.
Follow the Trend to Profit: Maximize your returns with a cashback account.
⚠️ Disclaimer: The content of this article is strictly for informational purposes and does not constitute investment advice. FXRebate is a rebate and affiliate service, not a broker or fund manager; responsibility for trades and funds lies exclusively with the third-party broker. Trading Derivatives carries a high level of risk to your capital and you should only trade with money you can afford to lose. Trading Derivatives may not be suitable for all investors, so please ensure that you fully understand the risks involved, and seek independent advice if necessary. Partner links used do not generate additional costs for you.