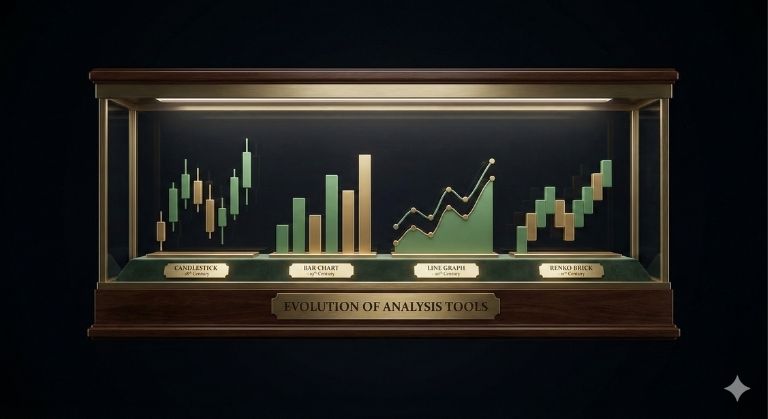
Candlesticks, Bars, Lines, and Renko Charts: Which Model is Best?
⏱️ Estimated Reading Time: 5 minutes
📝 Summary: Choosing the right chart type is a personal journey. This guide compares the simplicity of Line charts, the detail of Bars and Candlesticks, and the volatility-focused Renko bricks, helping you decide which fits your strategy.
Inexperienced traders often ask, “Which is the best chart type?” The truth is that this question has no definitive answer, as it ultimately depends on personal preference and experience. As traders gain more knowledge and skill, they may gradually move toward more sophisticated tools—and this is equally true in the case of charting techniques.
Historically, charting was first developed by individual investors seeking an advantage. One of the pioneers was Munehisa Homma, a Japanese rice trader of the 17th century, who developed the candlestick charting method. He is often regarded as the “God of markets,” utilizing price action long before Wall Street existed.
Table of Contents
1. Line Charts: Simplicity First
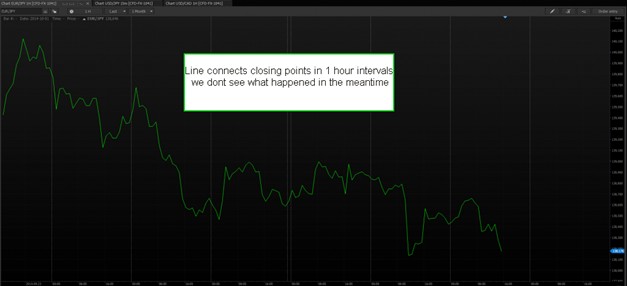
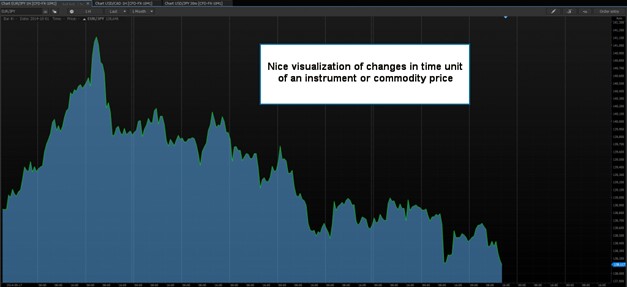
The Line Chart is the most basic representation of market data. It connects a series of data points with a continuous line. Typically, it tracks only the Closing Price of each period.
While it effectively cuts out market “noise” and gives a clear view of the overall trend, it hides intraday volatility. You won’t see how high or low the price went during the session, only where it ended.
2. Bar Charts (OHLC)
The Bar Chart (or OHLC chart) adds much more detail. Each vertical bar represents a specific time period and displays four key data points:
- Open: A small horizontal dash on the left.
- High: The top of the vertical bar.
- Low: The bottom of the vertical bar.
- Close: A small horizontal dash on the right.
This allows traders to see who controlled the session (buyers or sellers) and the extent of the volatility.
3. Japanese Candlesticks: The Gold Standard
Japanese Candlesticks offer the same information as Bar Charts (OHLC) but in a much more visual format. The area between the Open and Close is called the Body.
- If the Close is higher than the Open, the body is typically Green (or White).
- If the Close is lower than the Open, the body is Red (or Black).

The thin lines above and below the body are called Wicks or Shadows. They represent the extreme High and Low prices reached during the session. Candlestick patterns (like Pin Bars or Dojis) are crucial for Price Action trading because they reveal the psychology of the market instantly.

4. Renko Charts: Trading Without Time
More advanced traders often employ Renko charts (from the Japanese word “Renga,” meaning brick). Unlike the other types, Renko charts ignore time completely.
They are built using price movement alone. You define a “Brick Size” (e.g., 10 pips). A new brick is drawn on the chart only when the price moves by that specific amount.
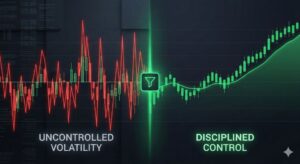
The Result: All minor consolidations and noise are filtered out, leaving a very clean chart that highlights trends and reversals.

5. Final Observations
Each chart type offers distinct advantages:
- Line Charts: Best for a quick overview of the long-term trend.
- Bar/Candlestick Charts: Essential for detailed technical analysis and Price Action.
- Renko Charts: Excellent for traders who want to eliminate noise and focus purely on volatility and trend direction.
Ultimately, the “best” chart depends on your objectives, experience, and trading style.
Find Your Trading Style.
Open a demo account and switch between Candlesticks, Bars, and Renko to see what works for you.
Frequently Asked Questions
Why are Japanese Candlesticks so popular?
They provide the most visual information instantly. The color of the body tells you who won the session (bulls or bears), and the wicks show rejection points.
Are Renko charts available on MT4?
Renko charts are not available by default on the standard MT4 installation. You usually need to install a custom indicator or Expert Advisor to generate them.
Do professional traders use Line charts?
Yes, many professionals use Line charts to identify major Support and Resistance levels on higher timeframes (Weekly/Monthly) because it removes the noise of the wicks.
⚠️ Disclaimer: The content of this article is strictly for informational purposes and does not constitute investment advice. FXRebate is a cashback and affiliate service, not a broker or fund manager; responsibility for trades and funds lies exclusively with the third-party broker. Trading with leverage involves high risks of capital loss. Partner links used do not generate additional costs for you.

