Three Ways to Use Moving Averages in Trading
⏱️ Estimated Reading Time: 5 minutes
📝 Summary: This guide explores three practical methods to incorporate Moving Averages into a trading strategy: using a single line for trend direction, dual lines for crossovers, and multiple lines to create a dynamic channel.
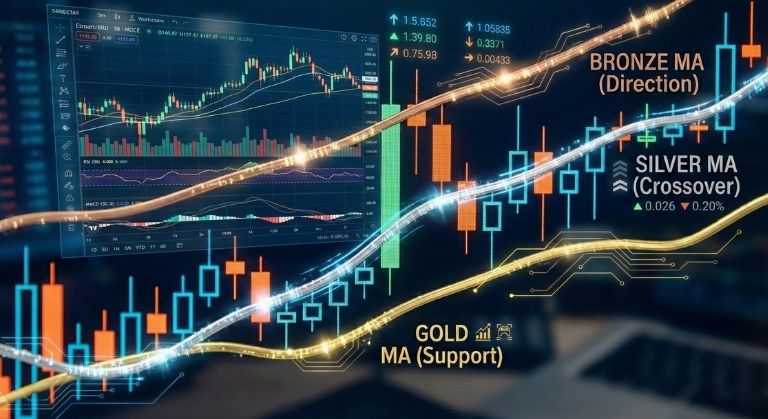
The moving average (MA) is perhaps the most time-tested indicator in financial history. Unlike subjective tools like hand-drawn trendlines, the moving average offers mathematical objectivity. It smooths out price data to reveal the underlying trend, acting as a dynamic support and resistance tool.
Table of Contents
Key Takeaways
- Trend Direction: Price above MA = Bullish; Price below MA = Bearish.
- Dynamic S/R: MAs often act as bouncing points for price during a trend.
- Crossovers: Use two MAs (Fast & Slow) to generate entry/exit signals.
- Lag: MAs are lagging indicators; they confirm trends rather than predict them.
1. The Single Moving Average (Trend Filter)
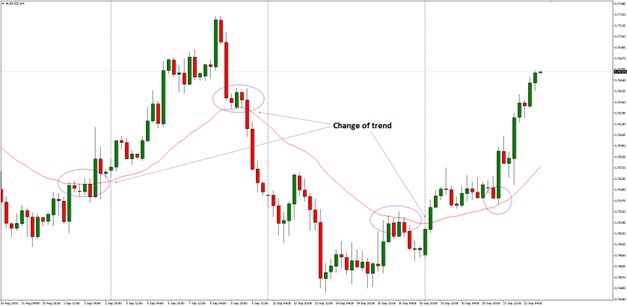
The simplest way to use an MA is as a trend filter. A common choice is the 200-period Simple Moving Average (SMA) on the Daily chart.
- Bullish Zone: If the price is above the moving average and the line is sloping upwards, only look for Buy trades.
- Bearish Zone: If the price is below the moving average and the line is declining, only look for Sell trades.
This method keeps you on the right side of the market momentum.
2. The Dual Moving Average (Crossover)
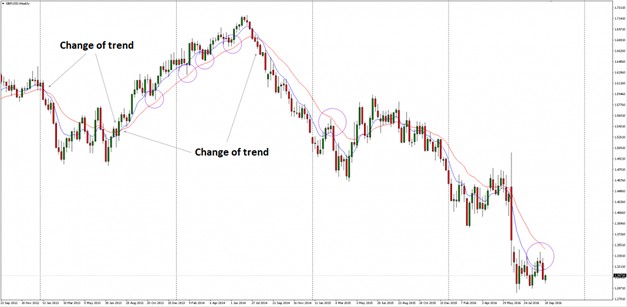
To generate specific buy or sell signals, traders often use two moving averages with different speeds: a Fast MA (e.g., 50-period) and a Slow MA (e.g., 200-period).
- Golden Cross (Buy): The Fast MA crosses above the Slow MA. This signals the start of a potential uptrend.
- Death Cross (Sell): The Fast MA crosses below the Slow MA. This signals a potential downtrend.
While effective in trending markets, this method can generate false signals in sideways (ranging) markets.
3. The Moving Average Channel
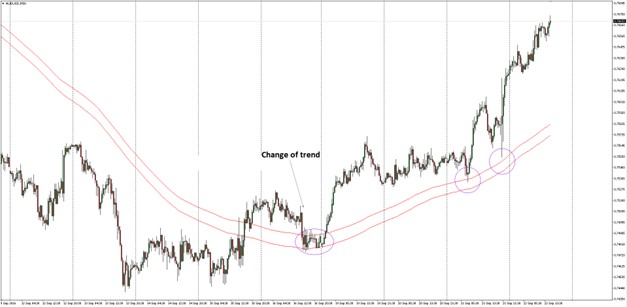
Instead of a single line, you can plot multiple MAs (e.g., High, Low, and Close) or create an envelope to form a channel.
This creates a visual “river” where the price flows. When the price stays within or above the channel, the trend is healthy. If the price breaks out of the channel aggressively, it may signal a volatility spike or a reversal.
Follow the trend efficiently.
Apply these Moving Average strategies on our platform and earn cashback on your trades.
Frequently Asked Questions
What is the difference between SMA and EMA?
SMA (Simple Moving Average) treats all data points equally. EMA (Exponential Moving Average) gives more weight to recent prices, making it react faster to new trends.
Which periods are best for Day Trading?
Day traders often use the 9 and 21 EMAs for quick signals on M5 or M15 charts, alongside the 200 EMA to identify the main trend direction.
Can MAs work in ranging markets?
Not effectively. In a sideways market, the price will constantly cross the MA back and forth, generating false signals (whipsaws). It is best to use oscillators like RSI in these conditions.
⚠️ Disclaimer: The content of this article is strictly for informational purposes and does not constitute investment advice. FXRebate is a cashback and affiliate service, not a broker or fund manager; responsibility for trades and funds lies exclusively with the third-party broker. Trading with leverage involves high risks of capital loss. Partner links used do not generate additional costs for you.