Price Action Trading Strategy: The Ultimate Guide
⏱️ Estimated Reading Time: 6 minutes
📝 Summary: This guide introduces the Price Action trading strategy, focusing on reading raw price data through key candlestick patterns like Pin Bars, Inside Bars, and Fakey setups, emphasizing the importance of market context over lagging indicators.
“What is Price Action?” is a question asked by nearly every beginner trader. The simple answer is that it represents the movement of price over time. However, as a trading strategy, it means making decisions based on clean charts—stripping away messy indicators to read the raw footprint of money in the market.
Table of Contents
Key Takeaways
- No Lag: Price Action focuses on current market behavior, unlike indicators which use past data.
- Simplicity: A clean chart allows for clearer decision-making without “analysis paralysis.”
- Key Patterns: Master the Pin Bar (rejection), Inside Bar (consolidation), and Fakey (trap).
- Context is King: A pattern is only valid if it appears at a key level (support/resistance) or within a trend.
1. What is Price Action?
Price action is the skill of interpreting raw price movements without the reliance on complex mathematical indicators. It acknowledges that price is the ultimate truth—it reflects all global variables (news, economic data, psychology) in real-time.
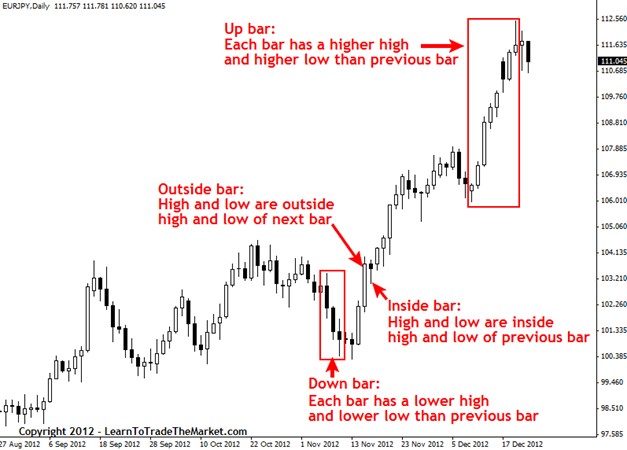
Bullish vs. Bearish Bars:
- Bullish Bar: Closes higher than it opened (or has higher highs/lows than the previous bar). It shows buyers are in control.
- Bearish Bar: Closes lower than it opened. It shows sellers are in control.
2. Clean vs. Messy Charts
To trade Price Action effectively, you must remove the clutter. Many beginners layer Stochastics, MACD, RSI, and Bollinger Bands onto one chart, creating confusion.
The Clean Chart Advantage: Without indicators obscuring the candles, you can see key Support and Resistance levels clearly. These levels are where the “action” happens.
3. The Pin Bar Signal
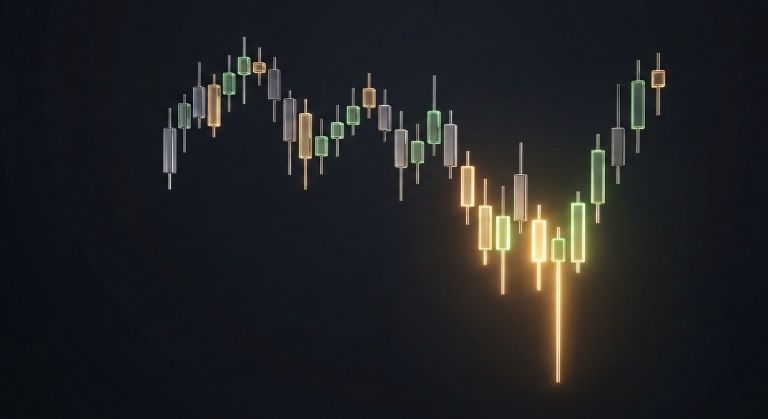
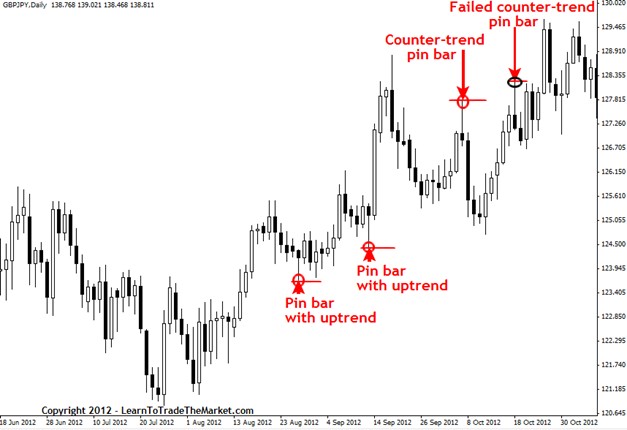
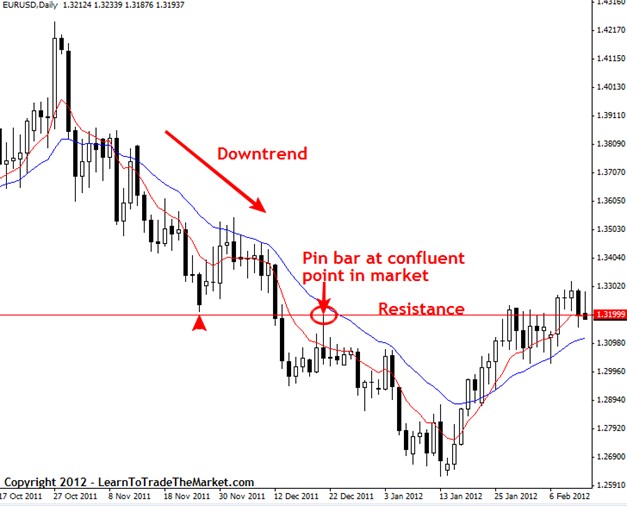
The Pin Bar (Pinocchio Bar) is a powerful reversal signal. It has a long “tail” or “wick” and a small body. The tail represents rejection of a price level.
- Bullish Pin Bar: Long tail pointing down. It shows sellers tried to push price down, but buyers aggressively pushed it back up.
- Bearish Pin Bar: Long tail pointing up. It shows buyers failed to sustain higher prices.
4. The Inside Bar Signal
An Inside Bar is a candle completely contained within the range (High to Low) of the previous “Mother Bar.” It represents consolidation or a pause in the market.
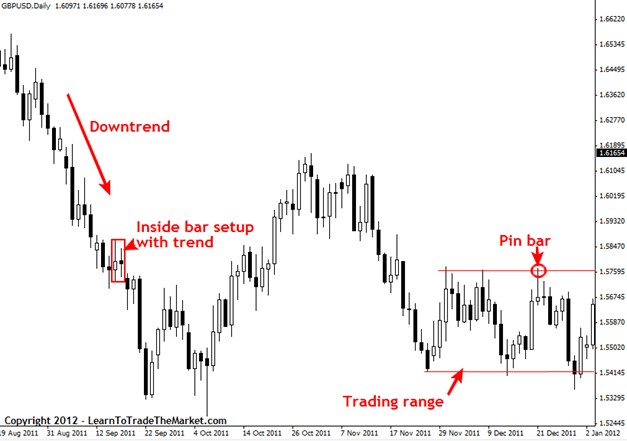
How to Trade It: Inside bars often precede a breakout. In a strong trend, they act as continuation signals—a brief rest before the market resumes its path.
5. The Fakey Pattern
The Fakey (False Breakout) is one of the most reliable setups. It occurs when price initially breaks out of an Inside Bar pattern but then quickly reverses, closing back within the range.
This is a “trap.” The big players have flushed out the amateurs who entered on the initial breakout. Trading in the opposite direction of the false break often yields significant profit.
6. Trading with the Trend vs. Consolidation
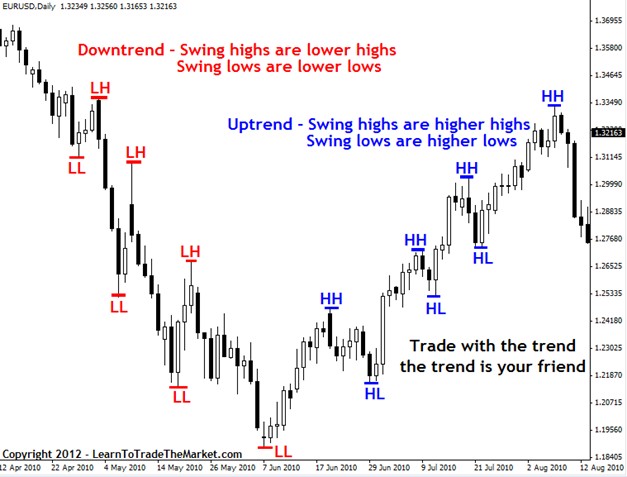
“Trend is your friend” is a cliché for a reason. Price Action signals are statistically more successful when aligned with the dominant trend (Confluence).
- In a Trend: Look for Pin Bars at key support levels (in an uptrend) or Inside Bars as continuation signals.
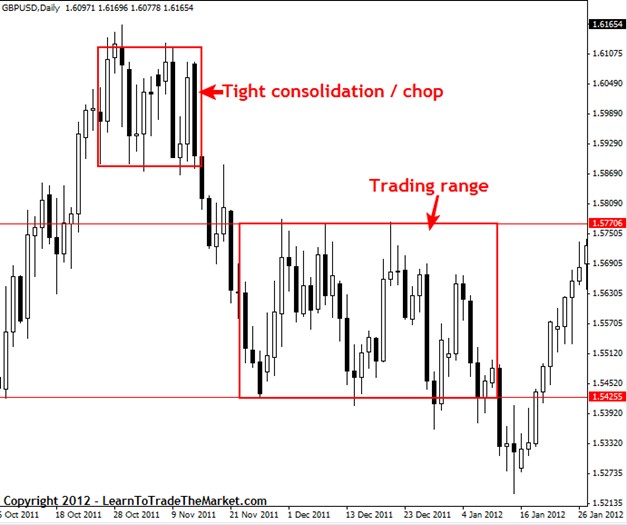
- In a Range: Look for Fakey patterns at the boundaries of the range to catch reversals back to the mean.
Master the raw market.
Use clean Price Action charts on our platform and get cashback on your trades.
Frequently Asked Questions
What is the best timeframe for Price Action?
The Daily (D1) chart is considered the “gold standard” because it filters out intraday noise and provides the most reliable signals. Beginners should start here.
Can I use Price Action without support and resistance?
Not recommended. A Pin Bar floating in the middle of nowhere means little. It becomes a tradable signal only when it rejects a key level or a moving average.
Is Price Action better than indicators?
Most professional traders prefer Price Action because it has no lag. Indicators are derivatives of price, meaning they tell you what happened in the past, while Price Action shows what is happening now.
⚠️ Disclaimer: The content of this article is strictly for informational purposes and does not constitute investment advice. FXRebate is a cashback and affiliate service, not a broker or fund manager; responsibility for trades and funds lies exclusively with the third-party broker. Trading with leverage involves high risks of capital loss. Partner links used do not generate additional costs for you.