
Pivot Points in Trading: The Mathematical Support & Resistance
⏱️ Estimated Reading Time: 7 minutes
📝 Summary: Pivot Points are objective levels calculated from previous price action. Unlike subjective trendlines, they provide fixed support and resistance zones (Daily, Weekly, Monthly) used by institutional traders.
In our view, Pivot Points represent one of the most important tools for trading. Unlike other indicators that can be subjective, Pivot Points are based on a mathematical formula using the previous period’s high, low, and close. This creates a “map” for the trading day that many professionals follow.
Table of Contents
1. What Appears on the Chart?
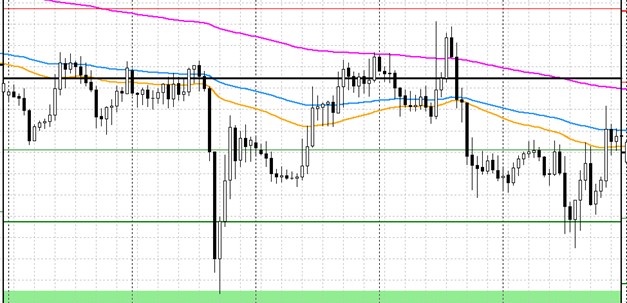
Pivot points consist of several horizontal lines that act as potential reversal or breakout levels:
- Pivot Line (P): The central reference line.
- R1, R2, R3: Resistance levels positioned above the pivot.
- S1, S2, S3: Support levels positioned below the pivot.
While it’s possible to calculate levels up to R4/S4, traders typically focus on the first three levels.
2. Calculation & Types
The lines are calculated based on data from the previous period (High, Low, Close). Depending on the timeframe you trade, you can use:
- Daily Pivots: For day trading (M5, M15 charts).
- Weekly Pivots: For swing trading (H1, H4 charts).
- Monthly/Annual Pivots: For long-term position trading.
The general principle is that price tends to oscillate around the central Pivot Line. Resistance levels (R) act as ceilings, while Support levels (S) act as floors.
3. Example: USD/JPY (Weekly Pivots)
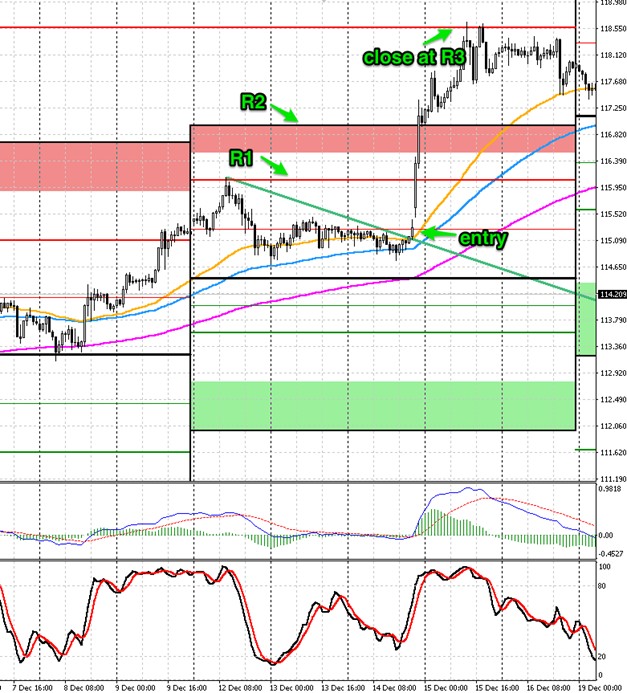
Let’s look at an hourly chart of USD/JPY using Weekly Pivot Points. The trend is upward, and the price remains above the central pivot line.
After a breakout above a trend line, a strong bullish move ends precisely at the R3 level. This is a rare but powerful scenario. In most cases, price reacts at R1 or R2, but strong news can push it to R3.
4. Example: GBP/JPY (Daily Pivots)
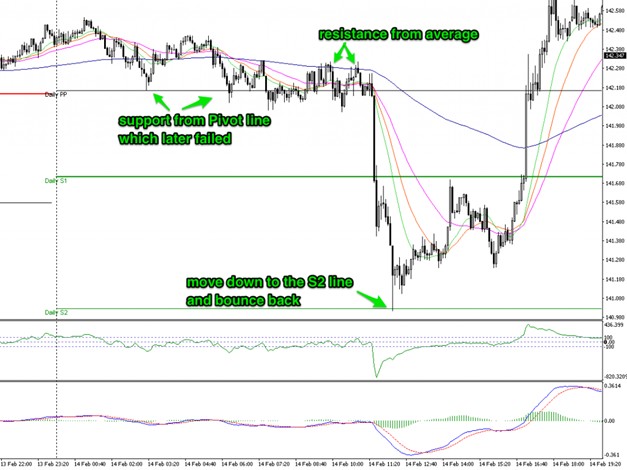
This chart represents GBP/JPY on a 5-minute time frame with Daily Pivot Points. Initially, the pivot line acted as support. However, once broken, the market sentiment changed.
Suddenly, GBP/JPY experienced a sharp decline, reaching the S2 level. The price touched S2 for only a brief moment before reversing. This highlights the importance of using Limit orders for Take Profit, as manually closing at such a speed is difficult.
5. Example: EUR/USD (Monthly Pivots)
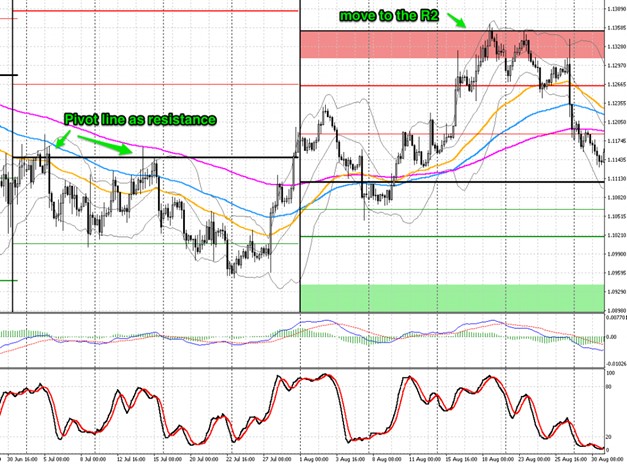
Finally, let’s look at EUR/USD on a 4-hour chart using Monthly Pivot Points. Although less common for day traders, monthly levels are crucial for understanding the bigger picture.
In this case, the central pivot line acted as resistance, and the price eventually moved towards the R2 monthly level, proving that these levels work across all timeframes.
Trade with Mathematical Precision.
Apply Pivot Points to your charts and test them on a risk-free demo account.
Frequently Asked Questions
Do Pivot Points repaint?
No. Unlike many indicators, Standard Pivot Points are calculated at the beginning of the period (day/week/month) and remain fixed until the period ends.
Which Pivot formula is best?
The “Standard” (Classic) calculation is the most widely used. There are others like Fibonacci, Woodie, or Camarilla, but for general S/R, the Standard version is recommended.
What happens if price breaks R3 or S3?
Breaking R3 or S3 indicates an extreme move. Traders should be cautious of reversals or look for continuation only if there is a strong fundamental driver (news).
⚠️ Disclaimer: The content of this article is strictly for informational purposes and does not constitute investment advice. FXRebate is a cashback and affiliate service, not a broker or fund manager; responsibility for trades and funds lies exclusively with the third-party broker. Trading with leverage involves high risks of capital loss. Partner links used do not generate additional costs for you.