
EMA Ribbon Scalping: The M1 Trend System
This visually intuitive strategy uses a “ribbon” of Exponential Moving Averages (EMAs) to identify short-term trends on the M1 and M5 timeframes. By grouping EMAs into three color-coded bands (Pink, Blue, Green), traders can easily spot crossovers and retracements for quick scalping entries.
Strategy Profile
Timeframe
M1, M5
Pairs
Major Pairs
Indicators
Multiple EMAs
1. Indicator Setup
Create three groups of EMAs to form the ribbon:
- Fast Group (Pink): EMAs 2, 3, 4, 5, 6, 7, 8, 9, 10, 11, 12, 13, 14, 15.
- Medium Group (Blue): EMAs 17, 19, 21, 23, 25, 27, 29, 31, 33, 35, 37, 39, 41.
- Slow Group (Green): EMAs 44, 47, 50, 53, 56, 59, 62, 65, 68, 71, 74.
2. Long Entry (Buy) Rules
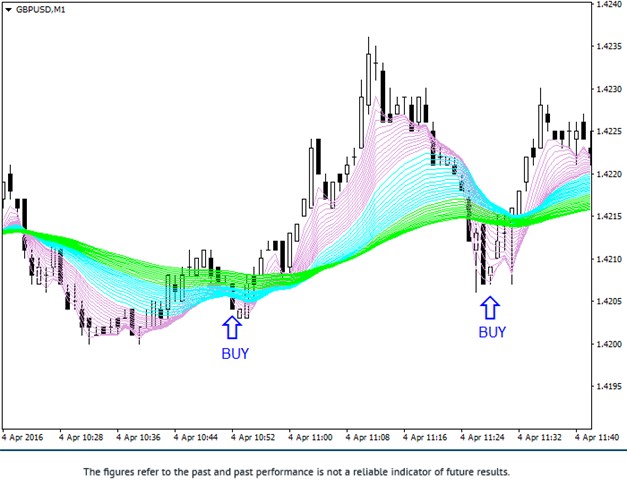
Look for the ribbon to twist upwards:
- Crossover: The Pink EMA group crosses above the Green EMA group.
- Retracement (Add-on): If price touches the Green or Blue zone and bounces back to Pink, add to the position.
3. Short Entry (Sell) Rules
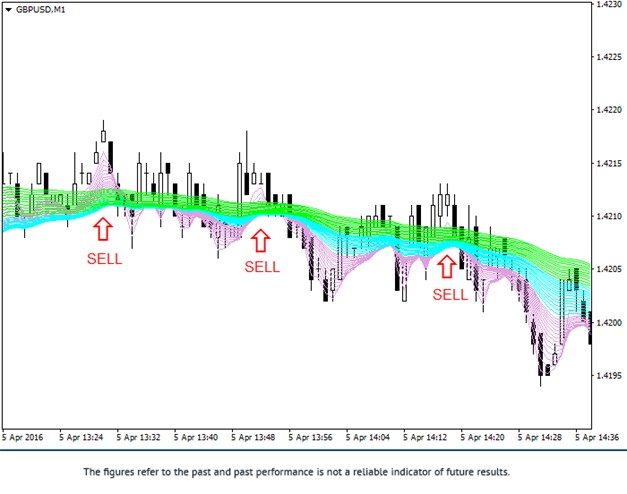
Look for the ribbon to twist downwards:
- Crossover: The Pink EMA group crosses below the Green EMA group.
- Retracement (Add-on): If price touches the Green or Blue zone and bounces back to Pink, add to the position.
Trade Management
- Take Profit (M1): 5-7 points (initial), 4 points (add-on).
- Take Profit (M5): 12-20 points (initial), 7 points (add-on).
- Stop Loss: 12 points (M1) or 18 points (M5) from entry.
Follow the Ribbon: Trade visual trends easily and earn cashback on every transaction.