
Parabolic SAR & Moving Averages: Strong Entry System
This is an easy-to-use trading strategy designed to identify strong entry points by isolating market noise. It combines the trend-following Parabolic SAR with a triple Exponential Moving Average (EMA) crossover system on the H1 timeframe.
Strategy Profile
Timeframe
H1 (Recommended)
Pairs
EURUSD, GBPUSD
Indicators
SAR + 3 EMAs
1. Indicator Setup
Apply the following indicators to your chart:
- Parabolic SAR: Step 0.1 (Note: Source text says “0,1” which is likely 0.1 step, or standard 0.02, 0.2. Check platform defaults).
- Moving Averages: Three EMAs with periods 6, 11, and 34.
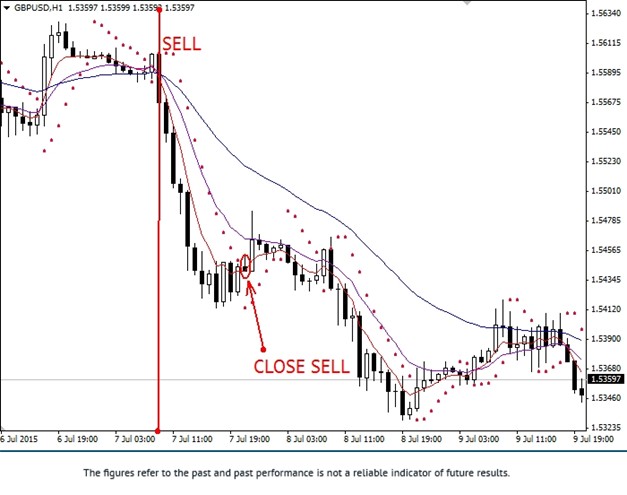
2. Short Entry (Sell) Rules
- MA Crossover: The faster EMAs are below the slower lines (EMA 6 < EMA 11 < EMA 34).
- SAR Signal: The Parabolic SAR dot appears above the current candlestick (flip from below to above).
3. Long Entry (Buy) Rules
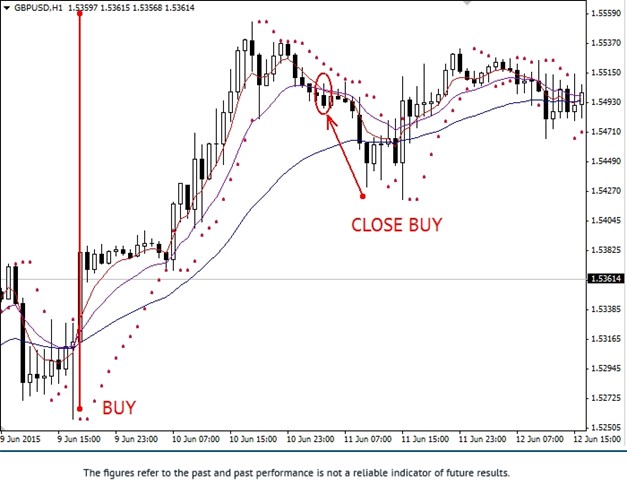
- MA Crossover: The faster EMAs are above the slower lines (EMA 6 > EMA 11 > EMA 34).
- SAR Signal: The Parabolic SAR dot appears below the current candlestick (flip from above to below).
Exit Strategy
Close the position when either:
- Signal 1: Parabolic SAR prints a dot on the opposite side of the price.
- Signal 2: The fast EMA 6 crosses the EMA 11 in the opposite direction.
Trend Following Made Simple: Use this EMA + SAR combo and get cashback on every trade.