
Parabolic SAR & Awesome Oscillator Trend Strategy
This trend-following strategy combines two powerful indicators: the Parabolic SAR for trend direction and trailing stops, and the Awesome Oscillator for momentum confirmation. By adding an EMA filter, this M30 system aims to enter trends only when multiple factors align.
Strategy Profile
Timeframe
M30
Pairs
USDCHF, EURUSD
Indicators
SAR + AO + EMA
1. Indicator Setup
Apply the following indicators to your M30 chart:
- Parabolic SAR: Step 0.01, Maximum 0.1. (Note: These are tighter settings than the standard 0.02/0.2).
- Exponential Moving Average (EMA): Period 5.
- Awesome Oscillator: Standard settings.
2. Long Entry (Buy) Rules
Look for full alignment of all three indicators:
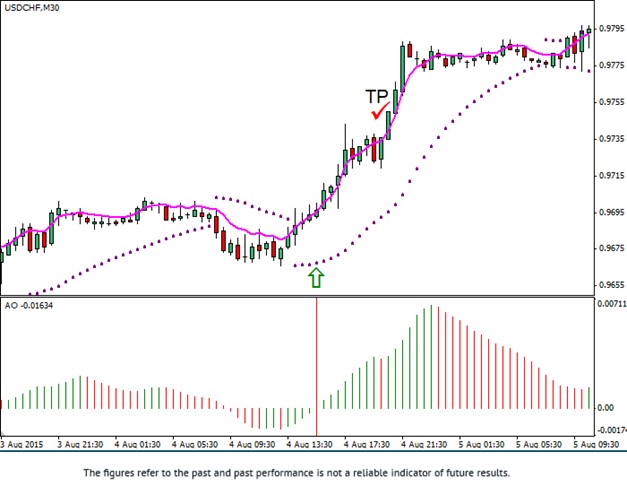
- Trend: The Parabolic SAR dots must be BELOW the current price candle.
- Momentum: The Awesome Oscillator histogram must be Green and located ABOVE the zero line.
- Confirmation: The 5 EMA line must be BELOW the current price.
3. Short Entry (Sell) Rules
Look for bearish alignment:
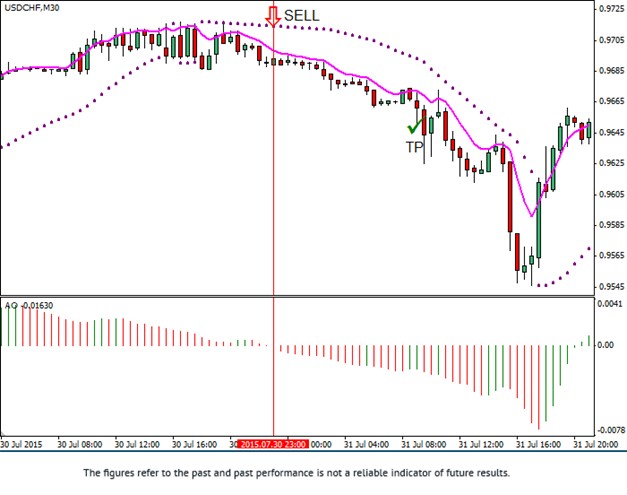
- Trend: The Parabolic SAR dots must be ABOVE the current price candle.
- Momentum: The Awesome Oscillator histogram must be Red and located BELOW the zero line.
- Confirmation: The 5 EMA line must be ABOVE the current price.
Exit Strategy
Stop Loss
USDCHF: 18 points.
EURUSD: 20 points.
Take Profit
USDCHF: 50 points.
EURUSD: 60 points.
Trend Following Pays Off: Maximize your returns with FXRebate cashback.